May 12, 2014
Key Points
- First quarter earnings season is largely in the books and the spread has widened out between the smaller cap/growth losers and larger cap/value winners.
- Overall, earnings were decent, especially relative to a previously and sharply lowered expectations bar.
- Valuations remain decent for the market overall; if still elevated for higher-flying segments.
First quarter earnings season is largely complete so it's time for an update, including on valuation. After cutting S&P 500 earnings estimates to the bone due to the first quarter's horrific weather, the bar was ultimately low enough for companies to outperform those lowered estimates. From a low estimate of -1%, they are now back up to +6% in year-over-year growth terms. S&P earnings estimates for the second quarter have been cut as well, and now stand at +7%, which is down from the recent high of 10%. This could mean the bar has been set too low yet again and that when earnings for the second quarter are released, they will again beat the consensus.
Beyond just the S&P 500, more than 2,000 companies reported earnings this past season. According to Bespoke Investment Group (BIG), after hanging out around the 60% mark for much of the season, the percentage of companies beating estimates was 57.4% as of Friday May 11. You can see below that, if the season were to end today, the "beat rate" would be the weakest since the bull market began over five years ago.
Earnings Beat Rate Down
Source: Bespoke Investment Group (B.I.G), as of May 9, 2014. *Q3 2001-Q1 2014.
Large trumping small
But it's not all bad news. The beat rate for the S&P 500 is quite a bit higher at 68%, reflecting the better performance by larger cap companies. In addition, the revenue (top line) beat rate for all ~2,000 companies having reported has remained steady above 56%, as you can see below.
Revenue Beat Rate Steadier
Source: Bespoke Investment Group (B.I.G), as of May 9, 2014. *Q3 2001-Q1 2014.
One notable trend has been the weakness in small cap stocks, which is at least in part a function of weaker small company earnings. The chart below shows where the earnings beat rate stood after each day during the first quarter's earnings season. Since large cap companies mostly report early in the season, followed by smaller cap companies, the beat rate dwindled as the season progressed.
Fewer Companies Beating
Source: Bespoke Investment Group (B.I.G), as of May 9, 2014.
Forward guidance
Fortunately, the guidance spread has remained positive according to BIG. This means more companies have raised forward guidance this season than lowered guidance, as you can see in the chart below.
More Companies Raising Guidance
Source: Bespoke Investment Group (B.I.G), as of May 9, 2014. *Q3 2001-Q1 2014.
Although the spread is only marginally positive, it is the first time in 11 quarters that more companies have raised guidance than lowered guidance.
By sector
The table below shows how earnings have come in by sector. It's among and sorted by the common sectors associated with the S&P 500, but the numbers relate to the broader market, not just the S&P 500. The sectors with the highest beat rates are Utilities and Technology, while those with the lowest beat rates are Consumer Staples and Materials.
Q1 2014 sector earnings per share stats
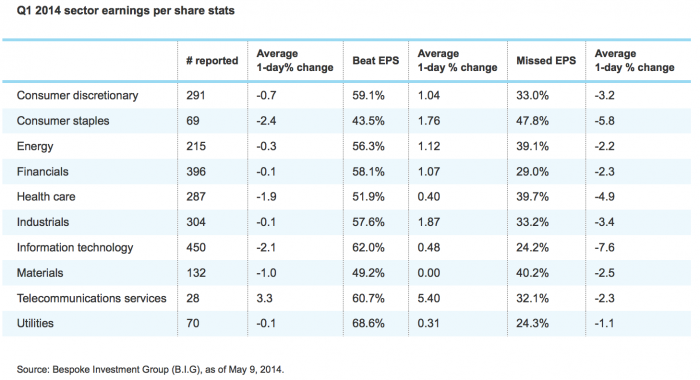
In terms of how the stocks are behaving once earnings are reported, the chart above is telling. Consumer Staples, Technology and Health Care stocks have taken the biggest beatings on their report days. Of the cyclical sectors, Technology actually has the highest earnings beat rate, but the stocks that have beaten estimates have averaged low one-day returns. Tech has the lowest earnings miss rate of any sector, but the stocks that have missed have been hit especially hard on earnings release days. While they're still averaging declines on their report days, sectors that have held up better than most are Energy, Financials and Industrials.
As a refresher, our sector recommendations are below:
Technology: Outperform
Consumer Discretionary: Outperform
Industrials: Outperform
Energy: Market Perform
Financials: Market Perform
Health Care: Market Perform
Materials: Market Perform
Consumer Staples: Underperform
Telecom: Underperform
Utilities: Underperform
What's mattered?
Another interesting set of data points BIG puts together relates to the stock market characteristics that have mattered most or least. Valuations have been a big driver of performance recently. The stocks with low P/E ratios and low growth expectations have done very well, while the stocks with high or no P/E ratios and high growth expectations have gotten hit particularly hard. As you can see in the matrix below, the top six deciles of stocks in the S&P 500 with the lowest P/E ratios have outperformed, while the bottom two deciles of stocks with high or no P/E ratios have averaged big declines.
S&P 500 decile performance last two months
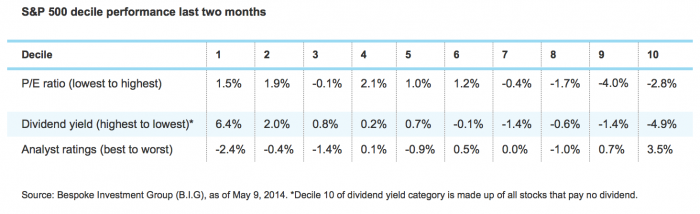
Along with the stocks with strong current earnings (low P/Es) going higher over the past two months, stocks with high dividend yields have done even better. Finally, the other characteristic that has impacted performance is analyst ratings; but not in the way you might think. As seen above, the deciles of stocks that analysts have the highest ratings on have averaged big declines, while the deciles of stocks that analysts hate the most have averaged nice gains.
Rotational (or "internal") correction
This shift toward value has been powerful and reflects the significant rotational correction that's been underway for a couple of months. So far it hasn't infected the broader market, as witnessed by the S&P 500 still near all-time highs, but the NASDAQ and Russell 2000 having more difficulty. We don't think the environment will change in the near-term.
But the move toward value can also be seen as a possible positive sign for the economy. Often in history, a move toward value is a signal that the economy is set to turn higher. To some this may seem counter-intuitive. But the rationale is that in a lower economic growth phase (like we were in recently), growth sells at a premium because it's in short-supply. But as prospects for economic growth accelerate, investors turn their attention toward value and/or growth-at-a-more-reasonable-price.
Valuation today
Finally, valuation still looks reasonable, while earnings growth is sufficient to keep the bull market alive. The consensus top-down estimate for 2014 is now over $115, while it's over $126 for 2015. That means the S&P 500 is trading around 16 times this year's earnings and below 15 times next year's earnings. Those remain no worse than in line with historic norms and suggest the market is no worse than fairly valued.
Important Disclosures
The information provided here is for general informational purposes only and should not be considered an individualized recommendation or personalized investment advice. The investment strategies mentioned here may not be suitable for everyone. Each investor needs to review an investment strategy for his or her own particular situation before making any investment decision.
All expressions of opinion are subject to change without notice in reaction to shifting market conditions. Data contained herein from third party providers is obtained from what are considered reliable sources. However, its accuracy, completeness or reliability cannot be guaranteed.
Examples provided are for illustrative purposes only and not intended to be reflective of results you can expect to achieve.
(0514-3304)
Copyright © Schwab.com