
by Gary Antonacci, Optimal Momentum
Interest in momentum is growing as it gains recognition as the premier market anomaly. Our purpose here is not to report on every item or research finding related to momentum. We prefer instead to point out those that are most important or interesting often because they seem exceptionally good, or, occasionally, because they seem exceptionally bad.
One exceptionally good piece of research is the working paper by Israel and Moskowitz (I&M) called "The Role of Shorting, Firm Size, and Time on Market Anomalies." This paper has important implications not only for momentum investors, but also for those who are interested in size and value investment tilts. I&M look at all three with respect to firm size, long or short market exposure, and results stability over time.
Most research papers on relative strength momentum present it on a long/short basis where you buy winning stocks and short losing ones. In some papers, you can find some long-only results buried in a table somewhere. Except in my papers, it can be challenging to find visual representations or detailed analyses of long-only momentum. However, I&M offer insightful analysis of long-only momentum. It is important to look at long-only results for two reasons. First, most investors are interested only in the long side of the market. Second, in the words of I&M:
Using data over the last 86 years in the U.S. stock market (from 1926 to 2011) and over the last four decades in international stock markets and other asset classes (from 1972 to 2011), we find that the importance of shorting is inconsequential for all strategies when looking at raw returns. For an investor who cares only about raw returns, the return premia to size, value, and momentum are dominated by the contribution from long positions.
Therefore, even if you are open to shorting, it does not make much sense from a return perspective.
I&M charts and tables show the top 30% of long-only momentum US stocks from 1927 through 2011 based on the past 12-month return skipping the most recent month. They also show the top 30% of value stocks using the standard book-to-market equity ratio, BE/ME, and the smallest 30% of US stocks based on market capitalization.
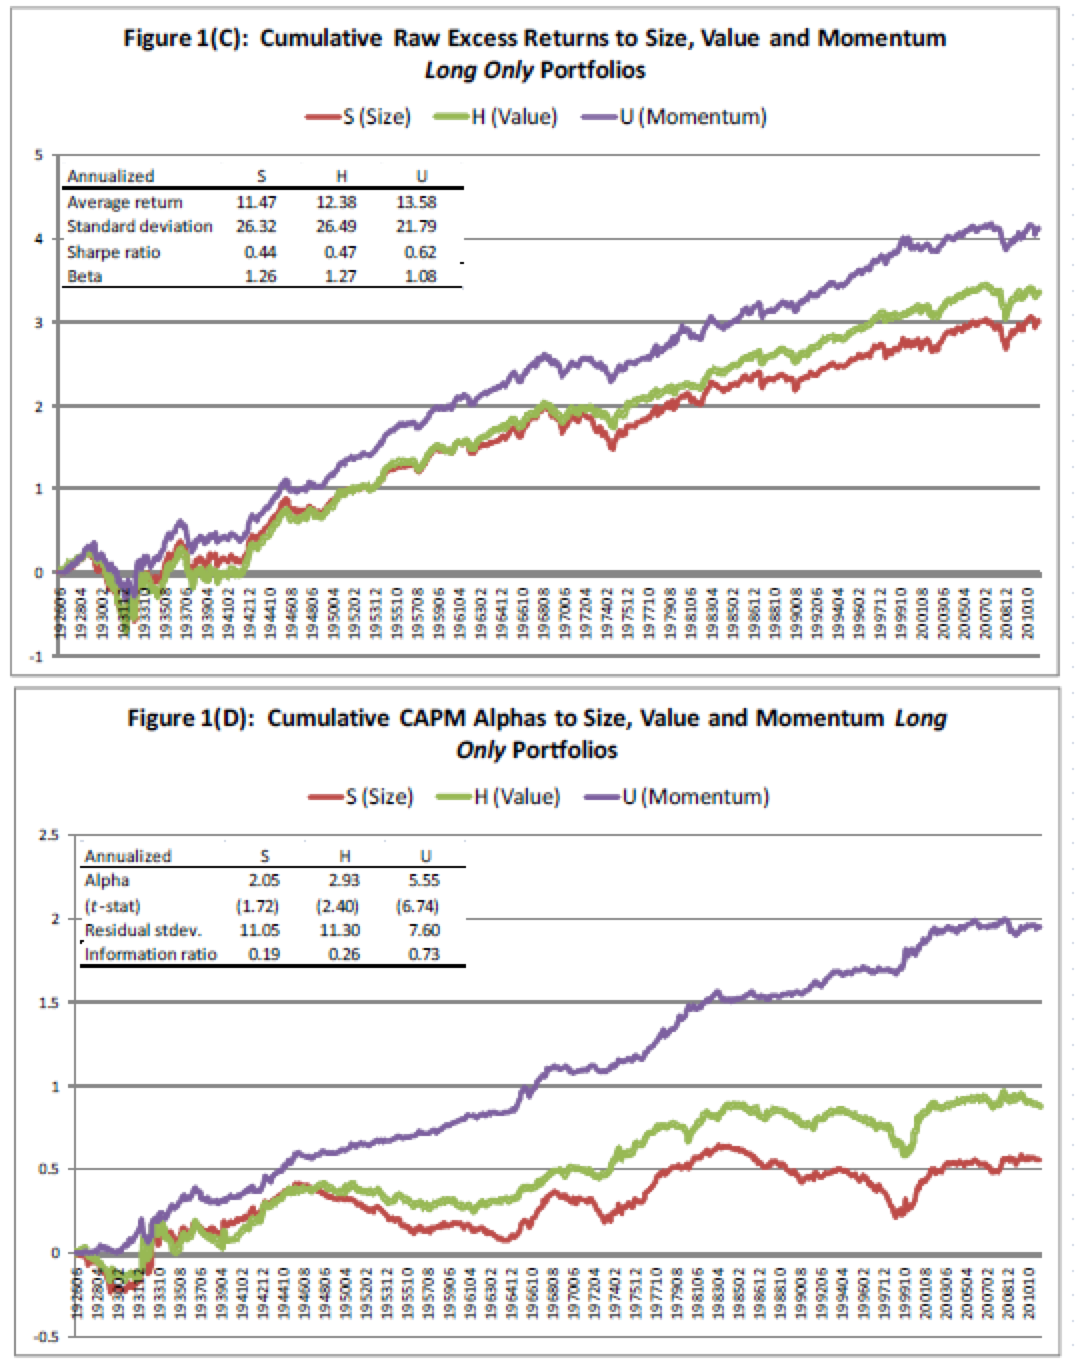
Long-only momentum produces an annual information ratio almost three times larger than value or size. Long-only versions of size, value, and momentum produce positive alphas, but those of size and value are statistically weak and only exist in the second half of the data. Momentum delivers significant abnormal performance relative to the market and does so consistently across all the data.
Looking at market alphas across decile spreads in the table above, there are no significant abnormal returns for size or value decile spreads over the entire 1926 to 2011 time period. Alphas for momentum decile portfolio spread returns, on the other hand, are statistically and economically large.
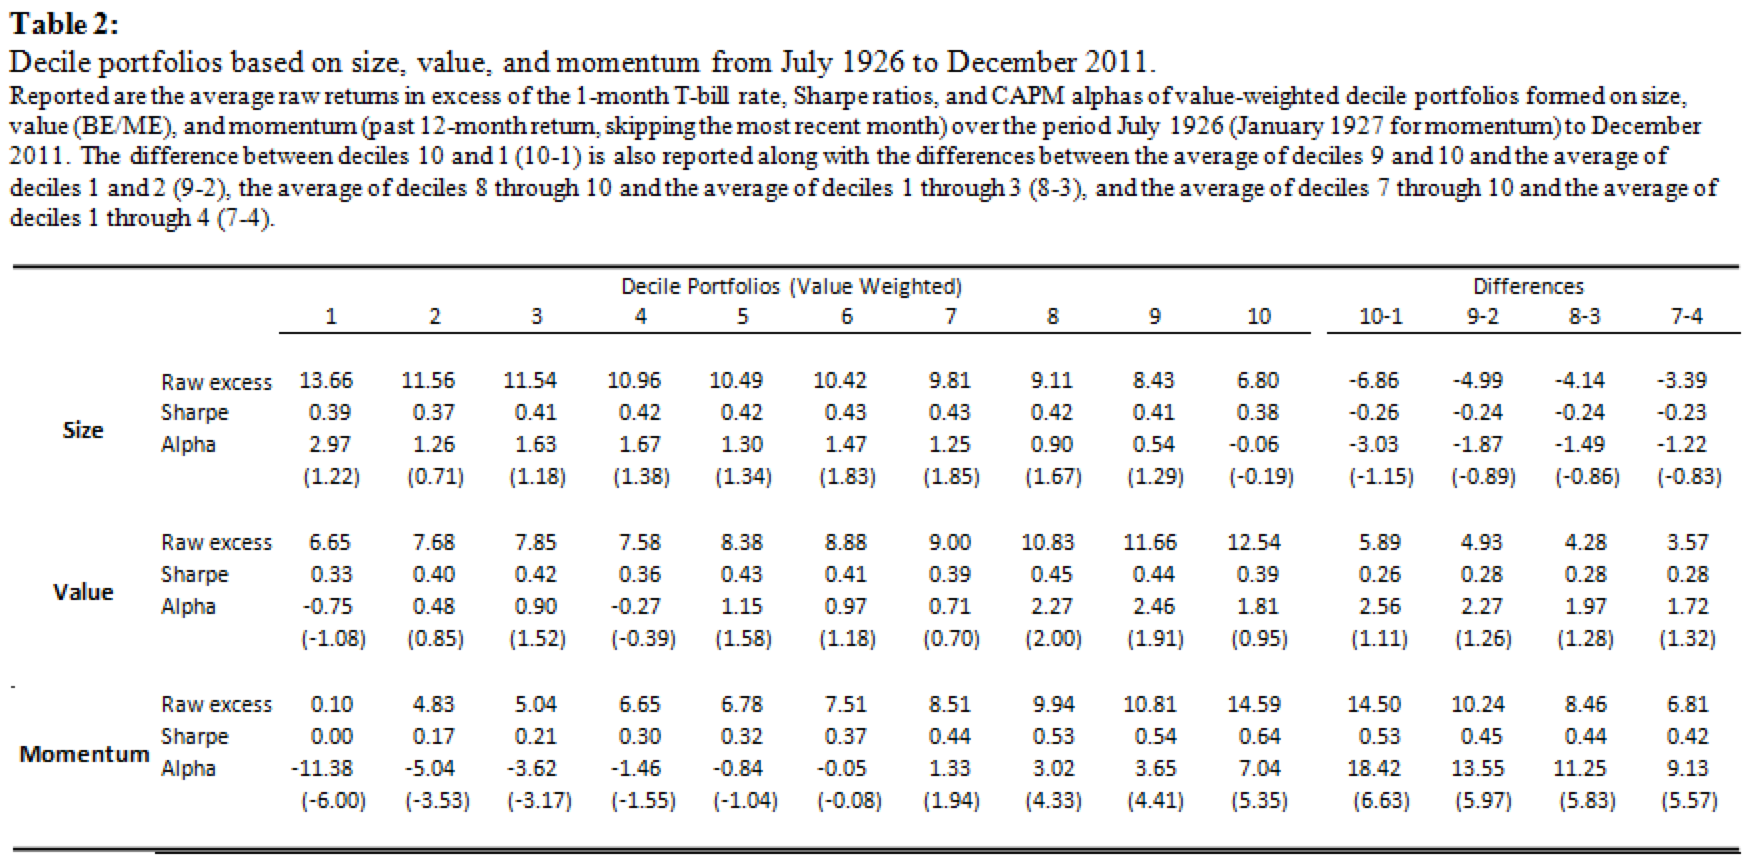
The table above shows alphas across different 20-year periods. (Our recent post called Momentum Backtesting described why it is important to have an abundance of data to segment and use as a robustness check.) Here is what I&M say about these results:
Looking at these finer time slices, there is no significant size premium in any sub period after adjusting for the market. The value premium is positive in every sub period but is only statistically significant at the 5% level in one of the four 20-year periods, from 1970 to 1989. The momentum premium, however, is positive and statistically significant in every sub period, producing reliable alphas that range from 8.9 to 10.3% per year over the four sub periods.
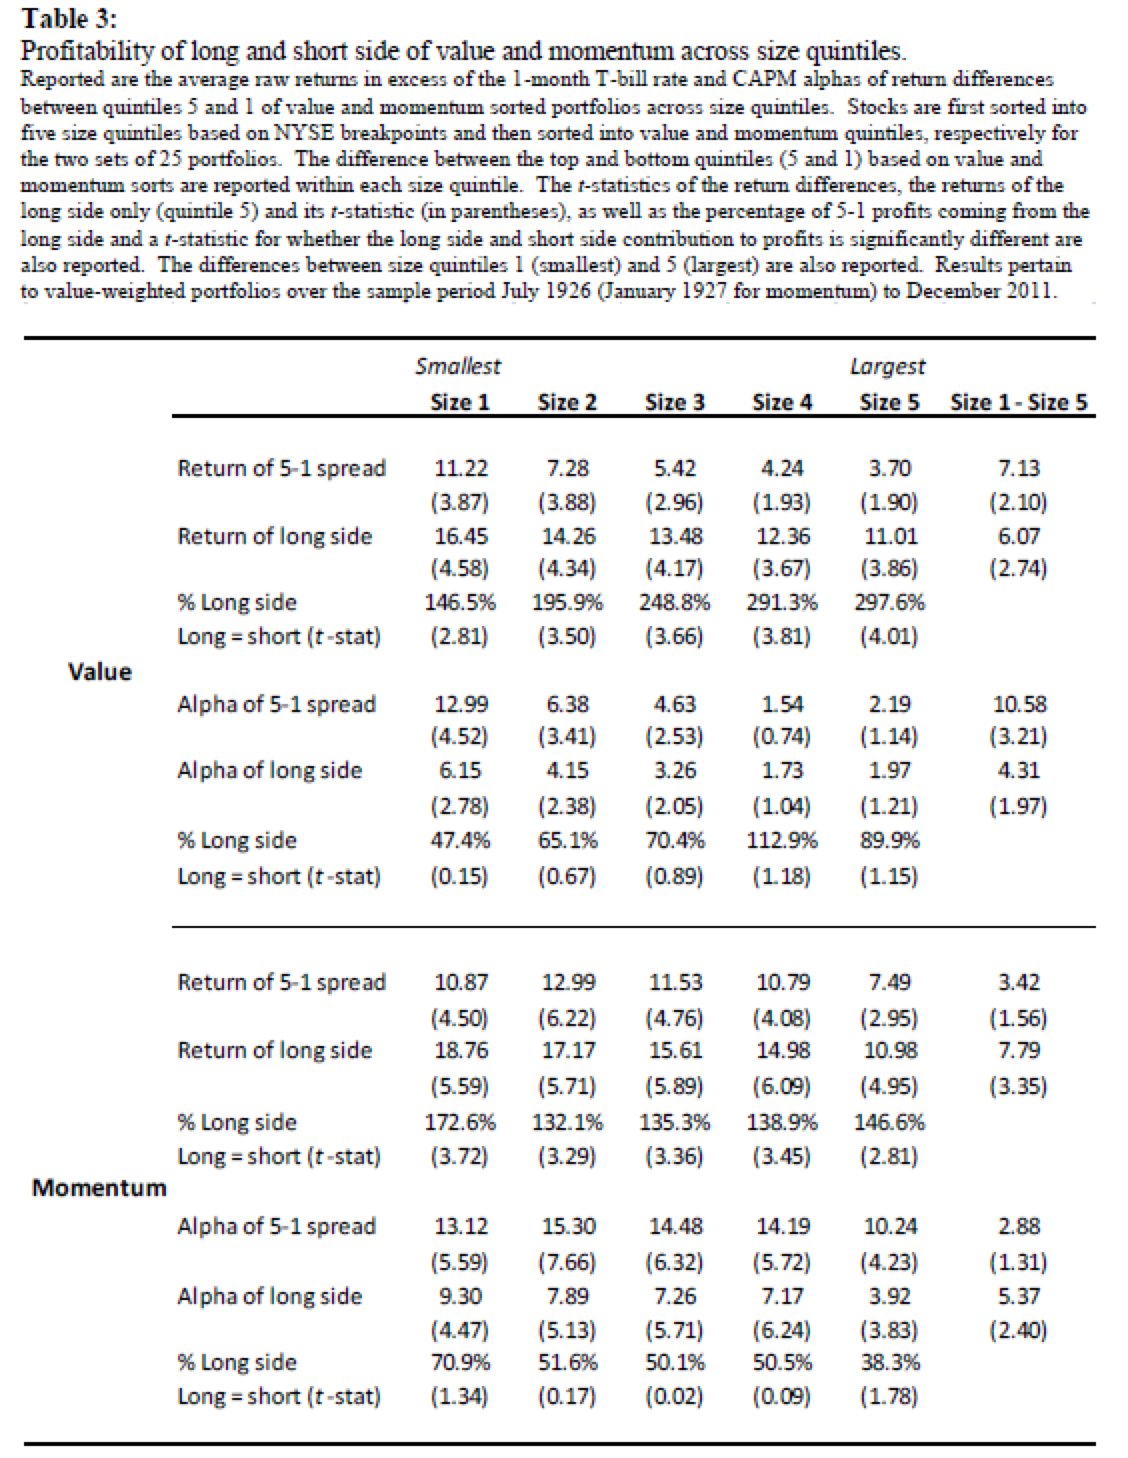
Here is one more table from their paper that shows in more detail the influence size has on momentum and value:

In the words of I&M:
Looking across different sized firms, we find that the momentum premium is present and stable across all size groups—there is little evidence that momentum is substantially stronger among small cap stocks over the entire 86-year U.S. sample period. The value premium, on the other hand, is largely concentrated only among small stocks and is insignificant among the largest two quintiles of stocks (largest 40% of NYSE stocks). Our smallest size groupings of stocks contain mostly micro-cap stocks that may be difficult to trade and implement in a real-world portfolio. The smallest two groupings of stocks contain firms that are much smaller than firms in the Russell 2000 universe.
So there you have it. Momentum returns are strong, stable, and largely unaffected by size over the entire 86-year sample period and in eight other markets and asset classes. Long-only value (per the most commonly used metrics), on the other hand, shows positive alpha only among small cap stocks and insignificant alphas among large cap stocks. Since small, micro-cap stocks are more costly and difficult to trade, most investors, and particularly institutional ones, avoid this area of the market. (The market cap of the entire S&P 600 small cap index ($703b) is less than the combined market cap of Apple and Exxon ($821b)). Not only is momentum the "premier market anomaly" as per Fama & French, but, contrary to popular belief, it may be the only practical anomaly.
Copyright © Optimal Momentum