by Jared Woodward. Condor Options
High implied correlation is a like an ongoing murmur of doubt about the ability of individual equities to trade on their own fundamentals. In “Two Themes to Watch in 2013” and “Three Reasons Equity Calls are Inexpensive,” I noted that one of the longest-lasting effects of the financial crisis was the high level of equity correlation implied by options on S&P 500 constituent stocks.
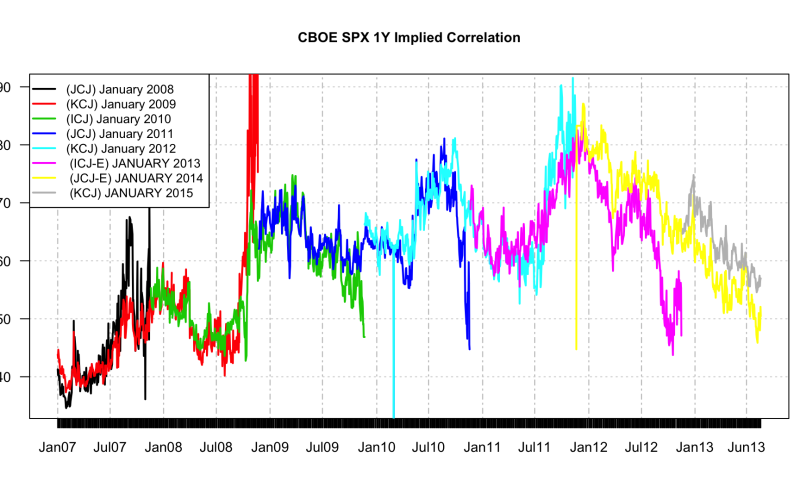
At this time of the year in 2011 and 2012, the next-nearest CBOE implied correlation indexes were quoted at 68.17 and 72.96. Those numbers don’t mean much intuitively, but in 2007 and 2008, the mean value of the January 2009 index was 49. Just as traders often think of a VIX between 15 and 20 as normal, one year S&P 500 implied correlation between 40 and 50 seems like a good baseline for the pre-crisis norm. In the years since the crisis, implied correlation has remained elevated even after implied volatility returned to normal.
Fig. 1. CBOE SPX 1Y implied correlation, 2007-2013. Source: CBOE, Condor Options
The good news is that implied correlation is still dropping. The values of the January 2014 and 2015 indexes were recently 50.44 and 56.93. New contract lows are a good thing for everyone and a great thing for fundamental investors. A low realized correlation environment means that the returns of S&P 500 constituents are no longer just one vote on the macroeconomic themes of the day, repeated over and over. A low implied correlation environment means that options prices reflect some confidence that the future might have low realized correlation, too.
Speaking of realized correlation:
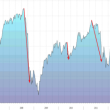
Fig. 2. S&P 500 Average 1 Month Stock Correlation. Source: Condor Options
The chart above shows the mean value of the most recent one month correlation of each S&P 500 constituent’s returns with the returns of the index. The average one month correlation of S&P 500 constituents to the index remained below 50% last week.
Two things that would inspire further confidence would be: i) a new January implied correlation index opening below 60. The January 2015 index was first quoted at 64.65 in November 2012, and we’ll see the next index in a few months; ii) a market correction of 5-10% or more in which realized correlation stays below 70% and the nearest implied index doesn’t jump so sharply.
Disclosure: SPX positions at the time of writing
Tags: icj, implied correlation, jcj, kcj, VIX