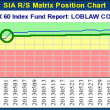


Ryan Lewenza, Sr. US Equity Strategist, and Team, TD Wealth, have launched, yesterday, their "new technical analysis report called The Technical Take. This bi-weekly report combines their technical analysis commentary found in the Weekly Insights, and their technical trades found in the Technical Almanac. The report also includes relative strength analysis for both the S&P/TSX Composite and S&P 500, sentiment indicators (with commentary when appropriate), a list of the most oversold/overbought stocks within the S&P/TSX Composite and S&P 500, and a market statistics page of key indices and sectors"
"We hope this “one-stop” technical report of commentary, trade ideas, and relevant technical information can help meet you and your client’s research needs. As always we welcome your feedback as we strive to provide the most relevant and high-quality research in supporting your businesses."
Highlights of today’s report include:
· The S&P/TSX Composite Index (S&P/TSX) remains range-bound between 11,800 and 12,900, which we expect to continue through the summer. In the short-term, the S&P/TSX is quickly approaching the important 50-day moving average (MA), which is likely to provide resistance.
· The technical profile of the S&P/TSX Energy Index is slowly improving, as it has transitioned from a downtrend into a sideways trading range. While the sector’s price trend is still neutral, we note the sector’s big improvement in its relative price trend, as the sector broke its two and a half year relative downtrend in June.
· While the technical profile of the S&P 500 Information Technology sector is slowly improving, one area that looks particularly attractive is the semiconductor space. The Semiconductor Index (SOX) is trading in a well-defined uptrend, and held up considerably well during the latest pullback in the overall market. This can be seen in its strong relative strength profile, as it remains in a relative uptrend since the November 2012 lows.
· The U.S. 10-year Treasury yield broke above an important resistance level of 2.40%, and is quickly approaching next key resistance around 3.0%. We see the U.S. 10-year yield being contained in the 3.0% to 3.25% range over the next six to nine months. In the short-term, we believe U.S. Treasuries are currently oversold and see the potential for a short-term rally in their prices and a decline in yields.
· Gold had been trading in a short-term range of US$1,320/oz to US$1,480/oz during the April through June period, but subsequently broke down through the key US$1,300/oz level. We viewed the US$1,300/oz as our “line in the sand”, where a break below this level would turn us outright bearish. Sticking with our technical discipline, our neutral view on gold turned bearish and we would look to reduce exposure into strength.
· In this week’s report we highlight Huntington Bancshares Inc. (HABN-Q), Union Pacific Corp. (UNP-N), and Great-West Lifeco, Inc. (GWO-T) as attractive technical trade ideas.
Regards,
Portfolio Advice & Investment Research
You may read/download the entire report in the slidedeck below: