Positioning Ahead of the FOMC Meeting
Taking a Core-Satellite Approach with Canadian Equities
Alfred Lee, CFA, CMT, DMS
Vice President & Investment Strategist
BMO ETFs & Global Structured Investments
BMO Asset Management Inc.
alfred.lee@bmo.com
September 11, 2012
Recent Developments:
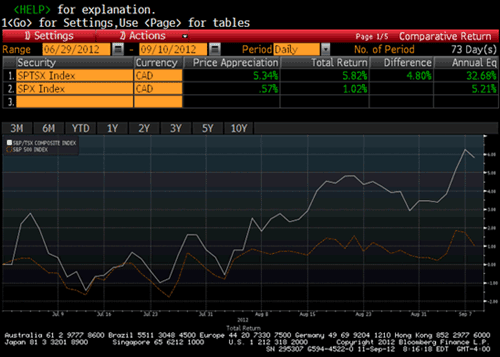
- While we have recommended an overweight to U.S. equities over the last two years, since early July, the S&P/TSX Composite Index (S&P/TSX) has been outperforming the S&P 500 Composite (SPX). This recent outperformance of Canadian stocks can be partially attributed to the rally in commodity stocks that resulted after a report in the Wall St. Journal noted the U.S. Federal Reserve Board (Fed) was moving closer to adding monetary stimulus to the economy (Chart A). At the same time, the rally in commodities has given the Canadian dollar some positive momentum over the same period, which was a big factor in the outperformance of Canadian equities. The release of the Fed meeting minutes several weeks ago went further to support investor speculation of monetary stimulus.
- Although we still favour U.S. equities over the longer-term, whether Canadian stocks continue to outperform over the short-term largely depends on whether the Fed announces a third installment of quantitative easing (QE3) or some monetary stimulus in the near future. Should we get further hints of some form of monetary stimulus on Thursday, the commodity heavy S&P/TSX would likely continue to rally. On the other hand, if Ben Bernanke disappoints, investors would likely rotate back into lower beta1 and defensive oriented stocks. Though it is likely that the Fed will continue to string the market along and postpone any monetary stimulus until after the Presidential elections, which would prolong the recent rally in cyclical assets.
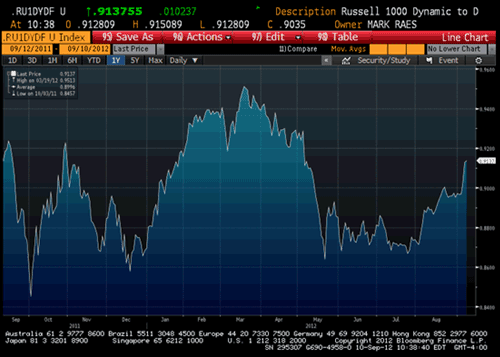
- Several key indicators to keep an eye on are the spread between the CBOE/S&P Implied Volatility Index (VIX2) and the S&P/TSX 60 VIX Index (VIXC3). If the VIXC drifts below the VIX, it is likely Canadian stocks will outperform over the short-term. However, if the VIXC rises significantly above the VIX, it is likely that Canadian equities will move back to underperforming U.S. stocks. In addition, indicators such as the Cyclical Stocks to Defensive Stocks ratio, would likely turn down should Canadian stocks begin to weaken (Chart B)
Investment Idea:
- As we pointed out earlier this year in the report "Hidden Rally in Canadian Equities", there have been many Canadian sectors outside materials and energy that have performed well year-to-date. For example the less cyclical consumer staples and telecommunications sectors are up 14.6%, and 7.0% in total returns year to date, respectively. In comparison the S&P/TSX is up 4.6% on a total return basis year to date, weighed down by the more economically sensitive material and energy sectors.
- Rather than owning a traditional market-cap weighted exchange-traded fund (ETF), investors can build their Canadian exposure using various ETF positions that allow them to better position themselves ahead of the Fed meeting. For example, low beta Canadian stocks have been an exposure factor that has worked so far in 2012. Investors can efficiently gain exposure to lower beta Canadian stocks through the BMO Low Volatility Canadian Equity ETF (ZLB). Investors can then supplement this position with a more cyclical or commodity-oriented ETF, such as the BMO Junior Gold Index ETF (ZJG).
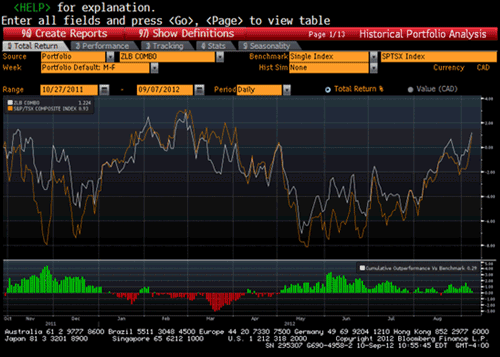
- Instead of holding a broad market Canadian equity ETF, combining ZLB and ZJG together may leave investors well positioned should we see hints of further easing from the Fed. For example, a combination of ZLB and ZJG in a 70%/30% mix has very similar returns to the S&P/TSX (Chart C). On the other hand, should the Fed disappoint investors and elect not to inject further liquidity, investors can drop the ZJG holding, thus efficiently peeling back the commodity trade, leaving the investor with just the more defensive-oriented, lower beta stocks. Keep in mind that the combined ZLB/ZJG position would be limited to a small percentage of portfolio, rather than making up the portfolio on its own.
Chart A: Canadian Equities Outperforming U.S. Equities Since Early July

Chart B: Cyclical to Defensive Stocks Ratio Has Turned Up Since Early August

Chart C: A Combined 70/30 Mix in ZLB & ZJG Has Very Similar Returns to the TSX

1 Beta: A measure of systematic risk, of a security or a portfolio in comparison to the market as a whole. A security that has a beta of 1 will move with the market, where as a security with a beta of less than or more than 1 will move less than or more than a market respectively.
2 VIX: The ticker symbol for the Chicago Board Options Exchange (CBOE) Volatility Index, which shows the market's expectation of 30-day volatility. It is constructed using the implied volatilities of a wide range of S&P 500 index options. This volatility is meant to be forward looking and is calculated from both calls and puts. The VIX is a widely used measure of market risk and is often referred to as the "investor fear gauge".
3 VIXC: The Canadian equivalent of the VIX, which is constructed using implied volatilities of the options of the S&P/TSX 60 constituents.
Disclaimer:
Information, opinions and statistical data contained in this report were obtained or derived from sources deemed to be reliable, but BMO Asset Management Inc. does not represent that any such information, opinion or statistical data is accurate or complete and they should not be relied upon as such. Particular investments and/or trading strategies should be evaluated relative to each individual's circumstances. Individuals should seek the advice of professionals, as appropriate, regarding any particular investment.
BMO ETFs are managed and administered by BMO Asset Management Inc, an investment fund and portfolio manager and separate legal entity from the Bank of Montreal. Commissions, management fees and expenses all may be associated with investments in exchange-traded funds. Please read the prospectus before investing. The indicated rates of return are the historical annual compound total returns including changes in prices and reinvestment of all distributions and do not take into account commission charges or income taxes payable by any unit holder that would have reduced returns. The funds are not guaranteed, their value changes frequently and past performance may not be repeated.


