by Guy Lerner, The Technical Take
I last looked at the technical picture for the Market Vectors Gold Miners ETF (symbol: GDX) on March 22, 2012. At that time, prices were near $50, and I was concerned that the GDX would roll out of its trend channel and would proceed lower in a waterfall type decline. This scenario appears to be happening.
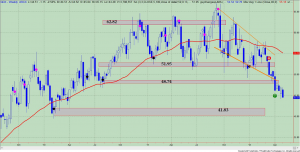
Figure 1 is a weekly chart of the GDX. The pink and black dots are key pivot points, which are the best areas of buying (support) and selling (resistance). As stated in the original article, a close below 3 key pivot points is “a pretty ominous sign regardless of the asset under consideration”. This was an early warning sign of trouble ahead, and this breakdown point is identified by the down red arrow as prices closed below the 51.95 support level. Once the 48.74 support level was taken out (up green arrow), prices were rolling out of the downward sloping trend channel. This water fall decline will likely end up at the next level of support, which is at 41.83. Moving to this level also would be consistent with price projections based upon the prior topping formation.
Figure 1. GDX/ weekly

In summary, GDX is heading to the next level of support at 41.83. I would look for prices to stabilize at this level.


