Is it Déjà Vu all Over Again?
April 30, 2012
by James Paulsen, Chief Investment Strategist, Wells Capital Management (Wells Fargo)
After nearly six months of persistently better-than-expected economic reports and a regularly rising stock market, metrics on the economy have turned a bit more mixed lately while stock market prices have struggled in recent weeks. This has caused many to wonder whether the economy and the stock market are headed again toward another “spring swoon” like those experienced during 2010 and 2011.
Spookily, conditions do seem remarkably similar today to those which preceded the last two spring thaws. In 2010, the stock market peaked on April 23 and in 2011 it peaked on April 29. Well, it’s April again and stocks are struggling? Moreover, in each of the last two years, just like this year, the spring stalls were preceded by improved economic reports and by a surge which carried stock prices to new recovery highs. Finally, rising gas prices have again played a dominant role in recent months as they did leading up to both of the last two spring swoons.
So, is everyone best advised to simply “Sell in May and Go Away”—something which worked well in each of the last two years? Although similarities to past swoons are troubling and while the recovery will inevitably “ebb and flow,” there are several critical differences evident this year which should help keep the economy and the stock market out of “swoon’s way” during the balance of 2012.
Economic Policies are More Accommodative
Economic policies are notably more accommodative today compared to either 2010 or 2011. In 2010, the pace of the M2 money supply had slowed to a restrictive 1 percent annual pace, and in early 2011 it was only rising at a very modest 4 to 5 percent pace. By contrast, today, the annual growth in the M2 money supply has persisted about a robust 10 percent clip since last fall!
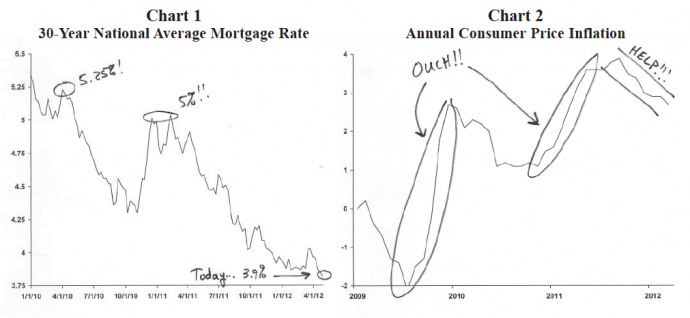
In both early 2010 and early 2011, the 30-year national average mortgage rate (Chart 1) rose above 5 percent prior to the spring swoons. Today, the mortgage rate is near an all-time record low below 4 percent! Significant accelerations in consumer inflation ravished household real incomes prior to both the 2010 and 2011 economic stalls. As illustrated in Chart 2, the annual rate of consumer price inflation jumped from -2 percent (deflation) in mid 2009 to about +2.5 percent by early 2010. Similarly, the annual inflation rate rose from about 1 percent at the end of 2010 to about 3.5 percent by 2011 springtime. These spikes in consumer prices significantly reduced real household income gains. Today, by contrast, real incomes are being boosted by a decline in the consumer price inflation rate from about 4 percent last fall to 2.7 percent currently!
While the Japanese tsunami had ravished U.S. manufacturing supply chains last year, today the “Japan bounce” is helping revive U.S. industrial activity. Finally, global economic policy officials are almost universally accommodative today. Until last fall, euro-zone officials refused to ease interest rates or expand the ECB balance sheet. Recently, however, both policies have been eased significantly! Similarly, until late last year, most emerging world economic policy officials were attempting to moderate recoveries by tightening policies. Now, nearly all of the emerging world is easing conditions to reaccelerate recoveries.
In both 2010 and 2011, economic policies were decidedly more restrictive and probably played a significant role in the resulting economic and stock market swoons. Today, however, much more accommodative global economic policies should bring a more favorable outcome.
U.S. Economic Recovery More Mature
The spring swoon in 2010 hit before the economic recovery had even reached its first anniversary. Today, the recovery is much more mature and therefore less vulnerable to swoons than it was in either 2010 or 2011.
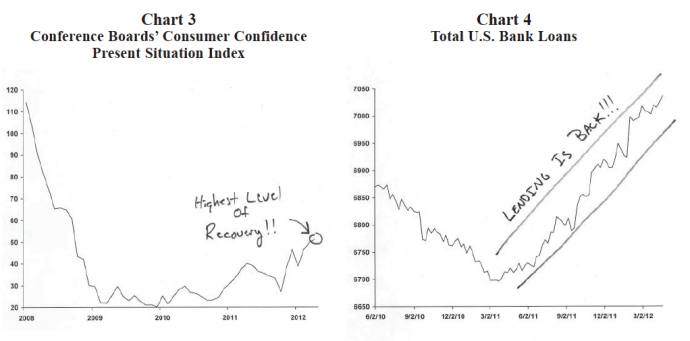
Several recent economic reports portray a maturing economy. In the first quarter, average monthly job gains were in excess of 200 thousand for the first time in this recovery. Initial weekly unemployment insurance claims have finally fallen below 400 thousand and the unemployment rate is enjoying its most persistent decline of the recovery. Additionally, the present situation consumer confidence index (Chart 3) has risen to a new recovery high, the economy has enjoyed the most robust retail spending of the recovery, auto sales have again recovered to about a 15 million annual pace, and an array of recent housing reports suggest the greatest level of housing activity since the industry collapsed. Finally, bank loans (Chart 4), absent during much of the first two years of this recovery, have risen steadily during the last year!
While the economic recovery has not yet surged ahead with strong momentum, many of the traditional engines of growth which often suggest a sustainable recovery (e.g., job creation, consumer and business confidence, improvement in big ticket spending propensities on cars and homes, and better bank lending) are now increasingly evident. With the economy simultaneously firing on so many more cylinders than it was in early 2010 or early last year, it appears much better equipped to weather adversities.
Household Fundamentals Much Improved
The U.S. household is also much less vulnerable to shocks compared to earlier in this recovery. Consumer fundamentals have improved markedly in the last year. The job market has finally come to life, consumer confidence has risen to its highest level of the recovery, and real wages and salaries are rising by about 2 percent in the last year compared to a negative growth rate in early 2010. The U.S. personal savings rate has averaged 5.1 percent in the last four years which represents the highest persistent savings rate in more than a decade, and the U.S. household liquidity ratio (cash holdings as a percent of net worth) has been hovering about a 20-year high since the start of the recovery. Moreover, despite virtually no recovery yet in housing prices, households have already regained almost two-thirds of the loss in net worth experienced during the crisis.


