


Section
Insight
19495 posts
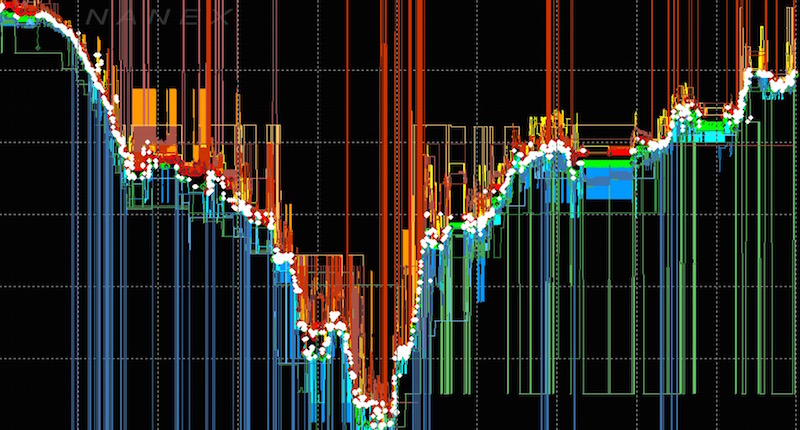
Liquidnet CEO: It's a Stock Picker's Market, Volatility and Turmoil are HFTs Playground
Liquidnet CEO Sees Stock Picker's Market Amid Turmoil Volatile Markets are HFTs Playground August 27, 2015 - Seth…

Navigating Volatility: The Case for Tactical Alpha
In today's volatile markets, alternative investments are key for diversification, resilience, and returns, but they demand expertise to navigate. Ash Lawrence, Head of AGF Capital Partners and Scott Radke, CEO and Co-CIO of New Holland Capital discuss...

The Market’s Downside Risk: How Much Further Could It Fall?
The Market’s Downside Risk: How Much Further Could It Fall? by Brad McMillan, CIO, Commonwealth Financial Network After…

Your Investments Should Look Like a Batting Line Up
Your Investments Should Look Like a Batting Line Up by Andrew Comstock, Castlebar Asset Management One thing I…

Awaiting the Elusive Market Bounce That Holds
Awaiting the Elusive Market Bounce That Holds by David Templeton, Horan Capital Advisors The stock market bears have…
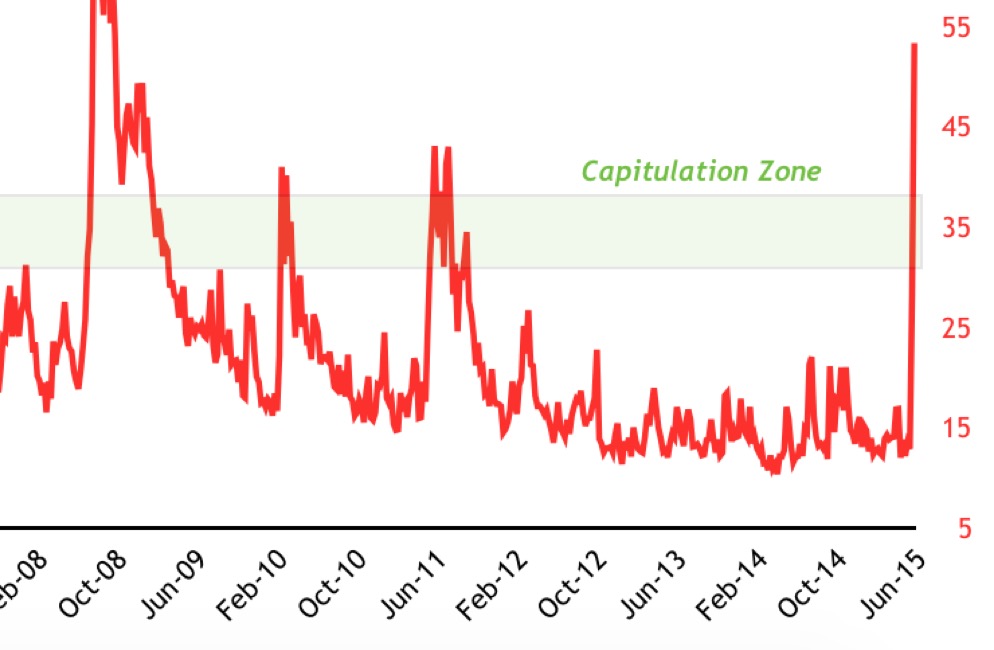
How Long Does it Take the Stock Market to Bottom After a VIX Spike?
How Long Does it Take the Stock Market to Bottom After a VIX Spike? The number of NYSE…

How to deal with market uncertainty?
How to deal with market uncertainty? by Adam H. Grimes I received a good question from a reader,…

Is Wall Street's Ex Machina Moment Coming?
Is Wall Street's Ex Machina Moment Coming? by Ben Carlson, A Wealth of Common Sense There’s a great…

6 reasons the FOMC is unlikely to move in September
6 reasons the FOMC is unlikely to move in September by Walter Kurtz, Sober Look The majority of…

Robots Do Not Take Vacations and Six Other Facts of Markets
Robots Do Not Take Vacations and Six Other Facts of Markets by Mike Harris, Price Action Lab The…

Things People Say During a Market Correction
Things People Say During a Market Correction by Ben Carlson, A Wealth of Common Sense In my younger…
James Paulsen: A Commodity Conundrum
The Commodity Conundrum by James W. Paulsen, Ph.D, Chief Investment Strategist, Wells Capital Management, Inc. A collapse in…
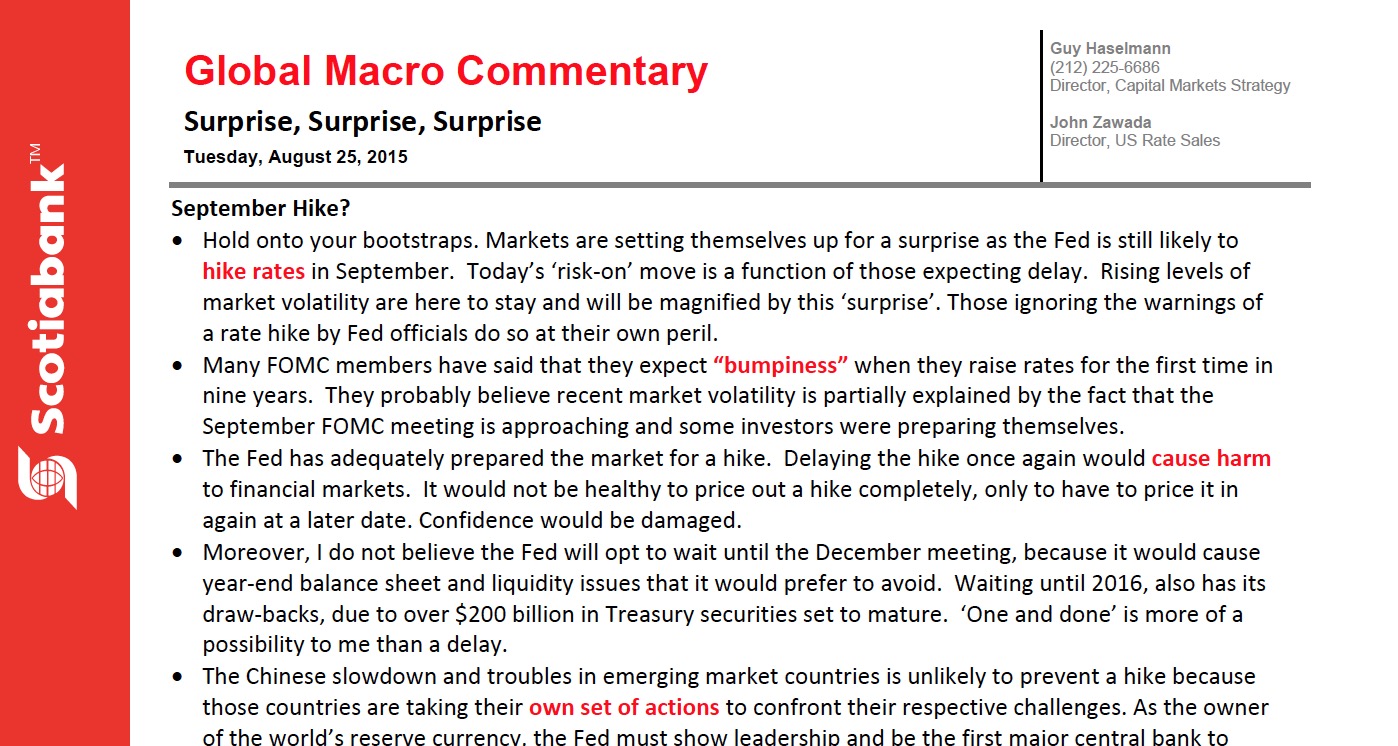
Guy Haselmann: September Hike?
September Hike by Guy Haselmann, Director, Capital Markets Strategy, Scotiabank GBM • Hold onto your bootstraps. Markets are…

The Market Downturn is Here – Now What?
The Market Downturn is Here – Now What? KEY TAKEAWAYS • As a bull market matures over the…
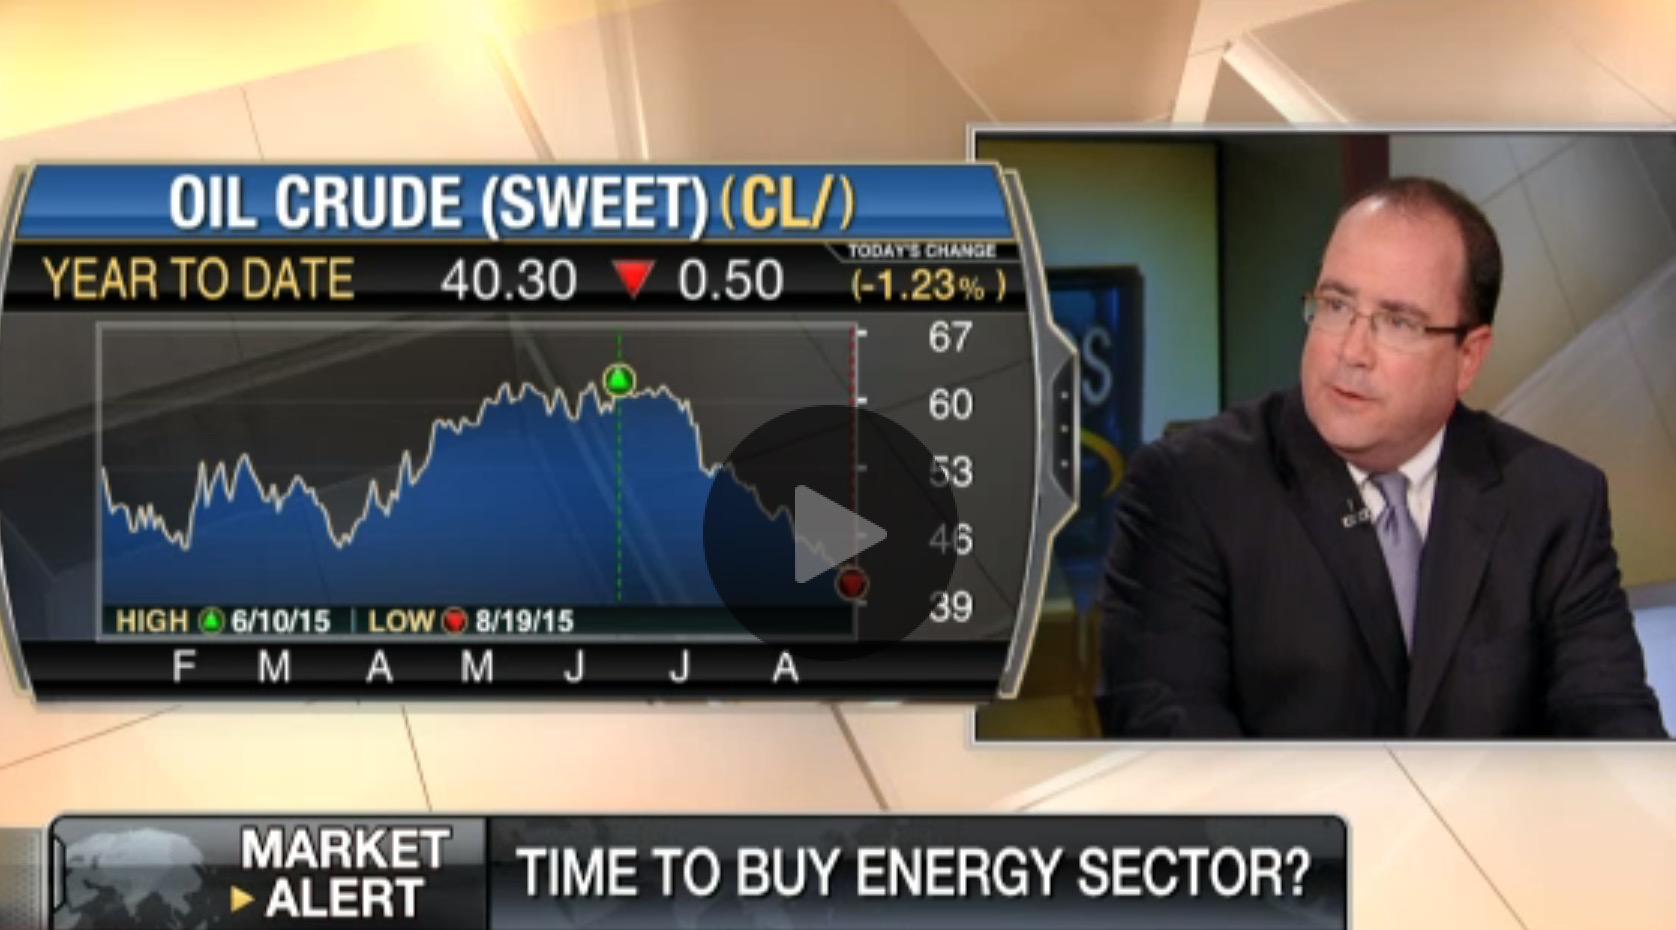
Time to Buy the Energy Sector?
Commonwealth Financial CIO Brad McMillan, Merrill Lynch Portfolio Solutions CIO Mary Ann Bartels and FBN’s Dagen McDowell on…

Relax, have a glass of wine
Relax, have a glass of wine by Cam Hui, Humble Student of the Markets Years ago, our infant…