


Section
Oil and Gas
893 posts
Drilling for Oil on Wall Street
Drilling for Oil on Wall Street by William Smead, Smead Capital Management As long-duration common stock owners and…

Navigating Volatility: The Case for Tactical Alpha
In today's volatile markets, alternative investments are key for diversification, resilience, and returns, but they demand expertise to navigate. Ash Lawrence, Head of AGF Capital Partners and Scott Radke, CEO and Co-CIO of New Holland Capital discuss...
Have Commodities Reached an Inflection Point?
Have Commodities Reached an Inflection Point? by Frank Holmes, CEO, US Global Investors Last week the Federal Reserve…
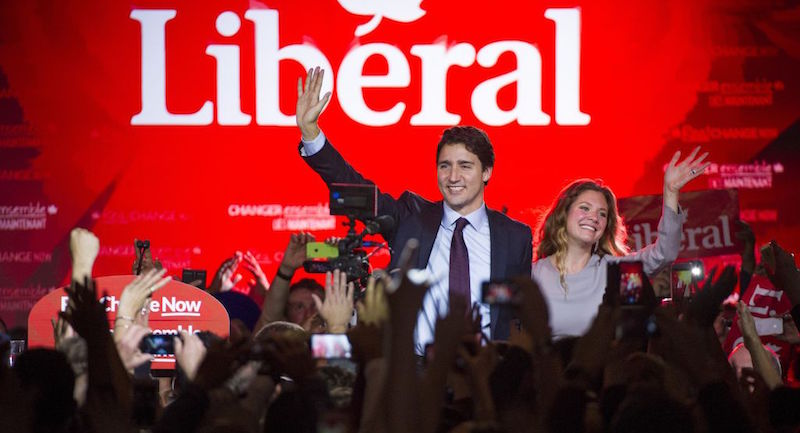
What Does Trudeau's Win Mean for Canadian Economy?
What Does Trudeau's Win Mean for Canadian Economy? Oct. 20 -- Cory Boles of Eurasia Group discusses the…
SIA Weekly: What's up with Natural Gas and Oil?
SIA Weekly: What's up with Natural Gas and Oil? by SIACharts.com For this week's Equity Leaders Weekly, we…

Canada and the oil price shock
Canada and the oil price shock by Norman Mogil, via SoberLook.com Canada is no stranger in dealing with…

Oil stocks are at a critical juncture
Oil stocks are at a critical juncture by Dana Lyons, J. Lyons Fund Management, Inc. One of the…
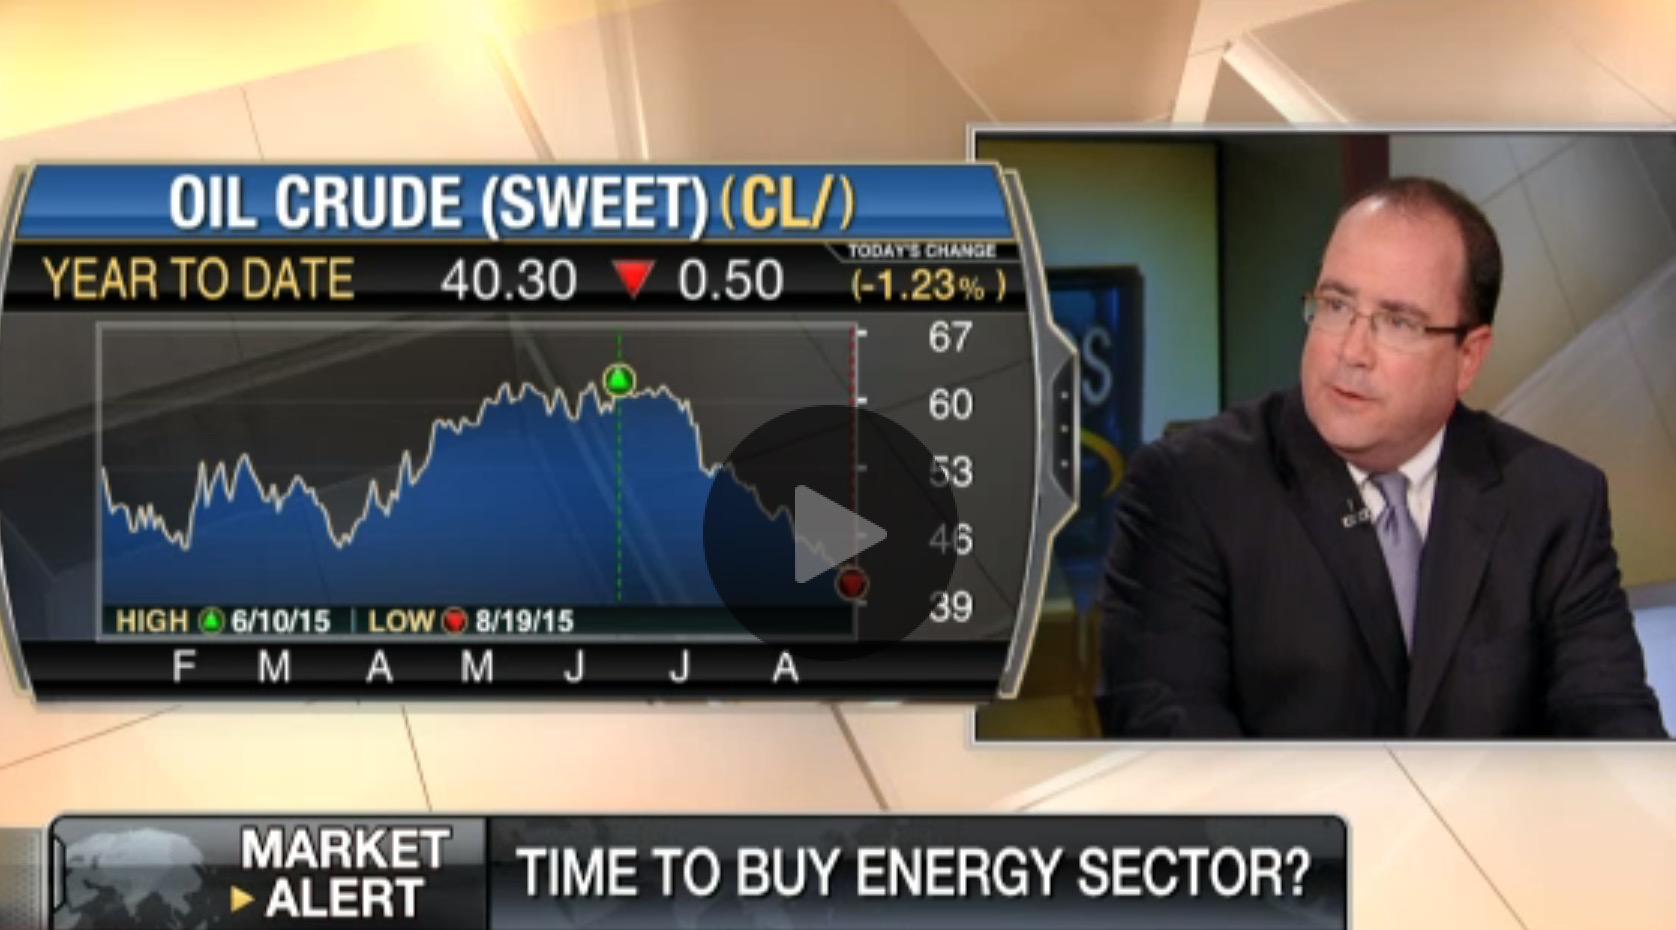
Time to Buy the Energy Sector?
Commonwealth Financial CIO Brad McMillan, Merrill Lynch Portfolio Solutions CIO Mary Ann Bartels and FBN’s Dagen McDowell on…
SIA Weekly: Two Large Canadian Sectors Leading the Way Down
Two Large Canadian Sectors Leading the Way Down by SIACharts.com For this week's SIA Equity Leaders Weekly, we…

Jeffrey Saut: The One Percent
The One Percent by Jeffrey Saut, Chief Investment Strategist, Raymond James Let me be blunt. If anyone of…

Crude Oil Extremely Oversold, Approaching Bottom
by Tiho Brkan, The Short Side of Long Crude Oil is extremely oversold from short and long term perspective…

Crude Oil Is the Best-Performing Commodity of 2015 So Far
Can we really be halfway through the year? That’s what my calendar tells me, which means it’s time for the 2015 commodities halftime report.
The periodic table of commodity returns, consistently one of our most popular pieces, has been updated to reflect the first half of 2015. Click on the table for a larger image. If you’d prefer your own copy of the original, simply email us.
click to enlarge
As an asset class, commodities continue to be a challenging space for investors, as they’ve faced many headwinds lately including lackluster purchasing managers’ index (PMI) numbers and a strong U.S. dollar.
click to enlarge
Crude Pulls off Coup but Faces Strong Downward Pressure
The widest expansion this year was made by none other than crude oil, the worst-performing commodity of 2014. As of June 30, oil posted gains of over 11 percent, rising to $59.47 per barrel. After falling more than 50 percent since last summer, though, it had little else to go but up. That oil claimed the top spot just highlights the reality that commodities are in a slump right now.
Case in point: This week, West Texas Intermediate (WTI) retreated to $50 per barrel, putting it back in the red for the year. This move was largely in response to Greece’s debt dilemma, China’s slowdown and weakening PMI numbers. After the JPMorgan Global Manufacturing & Services PMI was released, showing a continued downtrend in manufacturing activity, oil almost immediately dropped $4. The lifting of sanctions on Iran, if approved by Congress, could also place downward pressure on WTI, with some analysts seeing it returning to the $40s range.
As the 800-pound commodity gorilla, China greatly contributes to the performance of oil. Its own PMI reading remains below the key 50 threshold, indicating that its manufacturing sector is in contraction mode. This has a huge effect on the consumption of oil and other important commodities.
The good news is that the projected crude price for the remainder of 2015 should be high enough to support continued production in drilling areas such as the Bakken, Eagle Ford and Permian basins, according to the Energy Information Administration (EIA). The oil rig count, as reported by Baker Hughes, has advanced for the third consecutive week, after 29 straight weeks of declines.
click to enlarge
King Corn Pops to the Top
We all know that corn is in practically everything we eat and drink, from soda to bread to salad dressing. It’s fed to livestock and poultry and used to make ethanol, plastic, glue and more. The grain is so ingrained in our lives that the U.S. government subsidizes it to the tune of $4.5 billion a year.
For this reason and more, American farmers favor corn. In 2013, a record amount of it was grown and sent to market, which resulted in a price decline of 40 percent. That year it was the worst-performing commodity.
Since then, corn has found its footing and, as of June 30, returned 4.28 percent.
Zinc Is Flying off Car Lots
Sought for its anti-corrosive properties, zinc is staging a comeback and is set to make its longest run of gains in over a year, according to Mineweb.
The reason? Accelerating automobile sales in Europe. Zinc can be found in most car parts, from tires to door handles, and because it can store six times more energy per pound than more conventional battery systems, the metal is also used in electric vehicles.
The European Automobile Manufacturers Association reports that demand for new vehicles is up 14 percent year-over-year in June, its largest increase since December 2009. New car registrations in most European markets are seeing double-digit growth, with Portugal, Spain, Ireland and the Czech Republic leading the pack.
Gold Demand in China Sparkles
In a much-anticipated announcement, China broke its six-year silence on the amount of gold its central bank holds. And although the number jumped nearly 60 percent from 1,054 tonnes in 2009 to 1,658 tonnes, it underwhelmed the market, as many analysts had expected almost double the amount. Bullion fell to a fresh five-year low on Friday, while stock in Barrick Gold, the world’s largest producer, plunged to a level not seen since the Bush Administration—the elder Bush, that is.
But other news out of China, the largest purchaser of gold, suggests that the yellow metal is still very much on consumers’ minds. Just-released gold withdrawal numbers from the Shanghai Gold Exchange (SGE) came in at 1,180 tonnes—a huge amount—setting a new record for withdrawals in the first half period and leading many analysts to predict a new annual record.
click to enlarge
Gold demand in China normally cools around this time before picking up momentum in anticipation of the Chinese New Year. That demand has held up so well is a good sign for the second half of the year.
Even though gold’s down about 3 percent year-to-date, our Gold and Precious Metals Fund (USERX) is holding up. USERX currently has four stars overall from Morningstar, among 71 Equity Precious Metals funds as of 6/30/2015, based on risk-adjusted returns. This is a testament to the management skills of portfolio manager Ralph Aldis and our team of analysts. Check out Ralph’s MoneyShow interview, where he chats about some of his favorite gold companies.
The MoneyShow San Francisco
Last week I was in San Francisco attending the three-day MoneyShow conference, where I presented. If you weren’t able to make it, you can watch the presentation on-demand on your computer, tablet or smartphone by registering at eMoneyShow. The event will be available on-demand until August 8.
Please consider carefully a fund’s investment objectives, risks, charges and expenses. For this and other important information, obtain a fund prospectus by visiting www.usfunds.com or by calling 1-800-US-FUNDS (1-800-873-8637). Read it carefully before investing. Distributed by U.S. Global Brokerage, Inc.
Total Annualized Returns as of 6/30/2015
Fund
Year to Date
One-Year
Five-Year
Ten-Year
Gross Expense Ratio
Expense Cap
Gold and Precious Metals Fund
6.40%
-28.42%
-15.80%
1.62%
1.97%
1.90%
Expense ratios as stated in the most recent prospectus. The expense cap is a voluntary limit on total fund operating expenses (exclusive of any acquired fund fees and expenses, performance fees, extraordinary expenses, taxes, brokerage commissions and interest) that U.S. Global Investors, Inc. can modify or terminate at any time, which may lower a fund’s yield or return. Performance data quoted above is historical. Past performance is no guarantee of future results. Results reflect the reinvestment of dividends and other earnings. For a portion of periods, the fund had expense limitations, without which returns would have been lower. Current performance may be higher or lower than the performance data quoted. The principal value and investment return of an investment will fluctuate so that your shares, when redeemed, may be worth more or less than their original cost. Performance does not include the effect of any direct fees described in the fund’s prospectus which, if applicable, would lower your total returns. Performance quoted for periods of one year or less is cumulative and not annualized. Obtain performance data current to the most recent month-end at www.usfunds.com or 1-800-US-FUNDS.
Overall/71
3-Year/71
5-Year/68
10-Year/51
Morningstar ratings based on risk-adjusted return and number of fundsCategory: Equity Precious MetalsThrough: 6/30/2015
Morningstar Ratings are based on risk-adjusted return. The Morningstar Rating for a fund is derived from a weighted-average of the performance figures associated with its three-, five- and ten-year Morningstar Rating metrics. Past performance does not guarantee future results. For each fund with at least a three-year history, Morningstar calculates a Morningstar Rating based on a Morningstar Risk-Adjusted Return measure that accounts for variation in a fund’s monthly performance (including the effects of sales charges, loads, and redemption fees), placing more emphasis on downward variations and rewarding consistent performance. The top 10% of funds in each category receive 5 stars, the next 22.5% receive 4 stars, the next 35% receive 3 stars, the next 22.5% receive 2 stars and the bottom 10% receive 1 star. (Each share class is counted as a fraction of one fund within this scale and rated separately, which may cause slight variations in the distribution percentages.)
Gold, precious metals, and precious minerals funds may be susceptible to adverse economic, political or regulatory developments due to concentrating in a single theme. The prices of gold, precious metals, and precious minerals are subject to substantial price fluctuations over short periods of time and may be affected by unpredicted international monetary and political policies. We suggest investing no more than 5% to 10% of your portfolio in these sectors.
The S&P GSCI Spot index tracks the price of the nearby futures contracts for a basket of commodities.
The J.P. Morgan Global Purchasing Manager’s Index is an indicator of the economic health of the global manufacturing sector. The PMI index is based on five major indicators: new orders, inventory levels, production, supplier deliveries and the employment environment.
The U.S. Trade Weighted Dollar Index provides a general indication of the international value of the U.S. dollar.
Fund portfolios are actively managed, and holdings may change daily. Holdings are reported as of the most recent quarter-end. Holdings in the Gold and Precious Metals Fund as a percentage of net assets as of 6/30/2015: Baker Hughes Inc. 0.00%, Barrick Gold Corp. 0.03%.
All opinions expressed and data provided are subject to change without notice. Some of these opinions may not be appropriate to every investor. By clicking the link(s) above, you will be directed to a third-party website(s). U.S. Global Investors does not endorse all information supplied by this/these website(s) and is not responsible for its/their content.

Rude Awakening for Those who Ignored the Energy Markets' Warning Signs
by Walter Kurtz, Sober Look Back in February (see post) numerous equity investors refused to believe that a crude oil…

Guy Haselmann: China is Unfolding as the Most Important Story of 2015
by Guy Haselmann, Director, Capital Markets Strategy, Scotiabank GBM I believe the plunging of the commodity complex is…

Canada’s “Atrocious” Turn of Events
Guest post by Norman MogilThe Governor of the Bank of Canada (BOC), Stephen Poloz, was not kidding when he warned that the first quarter of 2015 would be “atrocious.” After a respectable fourth quarter in 2014, the Canadian economy took a turn for the worse: domestic demand fell by 1.7%, owing to a huge drop in business investment, while the other components of GDP barely registered positive results (see Chart 1).Chart 1: Canada Real GDP Canada is still suffering from the oil price shock, as much of this drop in business investment is from cancelled oil projects and lowered expected future production. Anticipating a weak first quarter, the Bank of Canada lowered its overnight bank rate from 1.00% to 0.75% in January both as insurance against a particularly bad performance and to weaken the Canadian Dollar. The BOC hoped that lower borrowing costs and a cheaper currency would sufficiently increase capital formation and improve Canada’s trade balance—especially with the U.S—to offset expected energy-related contractions.Did the BOC purchase enough insurance? Capital Formation SlumpsIn a separate survey Statistics Canada said capital spending in the non-residential sector is expected to decline a further 4.9% from 2014, while investment in energy is expected to decline by another 10%. Clearly, cutting the bank rate is not generating the new capital formation that the BOC desired, and it is becoming apparent that Canada cannot count on new investment to turn the economy around. With business reducing investment and consumers spending less, the two major engines of growth are idle at this important juncture. Can Canada rely on exports to revive the economy?Current Account Deficits WidenCanada has one of the world’s most ‘open’ economies (surpassed only by Germany in the G7), where exports compose about 30% of total national income. Thus, lower export cost should yield strong growth effects. As mentioned above, the BOC weakened the Canadian dollar by cutting rates in January. The Dollar has fallen almost 20% in the span of 6 months and remains under pressure.Chart 2 US $ soars against the "Loonie" 2014-2015Source: Bloomberg NewsDespite this effort to improve balance of trade, Canada continues to generate widening trade deficits.Chart 3 Canadian Exports and Imports Source : Statistics Canada, July 7,2015China’s weakening demand has put renewed pressure on Canadian exports: the export volume of metals and related products are down by 7%; volumes of minerals ore fell by 9%; and energy volumes were down 6.5%. The only bright spot was a modest increase in automotive exports. Overall, the merchandise trade deficit widened to $3.3 billion and Canada ran a trade deficit with the US in May—its first since 1990.Does the Canadian Dollar need to fall further to stem the outgoing tide of widening trade deficits? Economists at CIBC, tried to determine a ‘fair value’ for the Dollar and explain why the currency devaluation has failed to reduce the current account deficit: their model showed that the Canadian Dollar has been overvalued by 10% since 2009. The overvalued currency served as a form of monetary tightening. As the economists conclude: “given that we spent over 70% of the time since 2009 with core CPI under 2%, it shouldn’t be a huge surprise that our analysis suggests that monetary conditions have been tighter than the BOC’s official rate.” * It is apparent from this analysis and recent trends that Canada is in need of monetary loosening.Summing UpThe Canadian economy is no longer the darling of the G7, now that it is experiencing recessionary conditions;To a large extent, the weakness is due to totally exogenous forces and out of the hands of Canadian policy makers, e.g. the stunning decline in all commodity prices ;To a lesser extent, a relatively tight monetary policy combined with an overvalued exchange rates are well within in the purview of the policy makers.On July 15th the BOC meets to set the bank rate. Upper most in their minds will be the ‘atrocious’ first quarter and, in particular, the weakness in the external sector, so vital to the health of the Canadian economy. A lot will be riding on that meeting. Stay tuned.To avoid the technical measure of a recession, the economy needs to record increases of 0.2% and 0.3% in May and June, respectively---- a tall order given the performance to date. Analysts are whispering among themselves on the probability of a full recession by the end of the summer.*Rich Loonie to Slow Poloz, N. Exarhos and A. Shenfeld, CIBC Dept. Of Economics, July, 2015_________________________________________________________________________Sign up for our daily newsletter called the Daily Shot. It's a quick graphical summary of topics covered here and on Twitter (see overview). Emails are NEVER sold or otherwise shared with anyone._________________________________________________________________________From our sponsor, Fitch Solutions: Sign-up for Inside Credit - a weekly wrap-up of noteworthy Fitch content delivered every Friday.SoberLook.comwww.SoberLook.com
USDCAD Trend Favours USD, Oil May Be Rangebound $50-60
by SIACharts.com For this week's SIA Equity Leaders Weekly, we are going to focus on the USDCAD relationship…