by Ryan Detrick, LPL Research
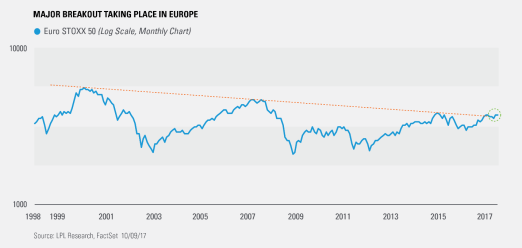
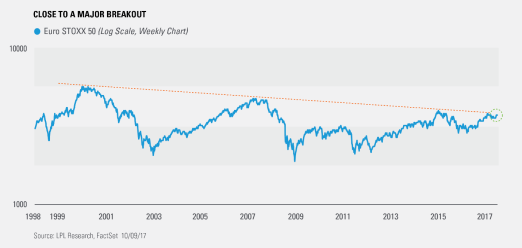
As we noted yesterday, small caps have improved and technically could break through a significant trendline that would suggest continued strength. That would be a good thing for the bull market in the U.S., but an even more important bullish development could be taking place overseas. The Euro STOXX 50 (think of this as the Dow for Europe) is in the process of breaking out above a bearish trendline that has been in place for more than 17 years, which could bode well for continued strength into 2018.
[NEI-0001]Here’s where things get interesting. The monthly chart above shows the Euro STOXX 50 has broken above its long-term trend, but the weekly chart below shows us that the breakout hasn’t happened yet. This is why it is important to look at varying timeframes.
Given various global markets are already breaking out, it is likely only a matter of time until the Euro STOXX 50 breaks out above this trendline. Per Ryan Detrick, Senior Market Strategist, “Though when looking out into 2018 we continue to see better opportunities domestically and in emerging markets, Europe is finally pulling its own weight. This is yet another sign that we are amid a global bull market and it should continue into 2018, if not further.”
*****
IMPORTANT DISCLOSURES
The economic forecasts set forth in the presentation may not develop as predicted.
The opinions voiced in this material are for general information only and are not intended to provide or be construed as providing specific investment advice or recommendations for any individual security.
Stock investing involves risk including loss of principal.
Investing in foreign and emerging markets securities involves special additional risks. These risks include, but are not limited to, currency risk, political risk, and risk associated with varying accounting standards. Investing in emerging markets may accentuate these risks.
The EURO STOXX 50 Index is a blue-chip index for the Eurozone, which covers 50 stocks from 12 Eurozone countries: Austria, Belgium, Finland, France, Germany, Greece, Ireland, Italy, Luxembourg, the Netherlands, Portugal, and Spain.
Dow Jones Industrial Average (DIJA) is the most widely used indicator of the overall condition of the stock market, a price-weighted average of 30 actively traded blue-chip stocks, primarily industrials. The 30 stocks are chosen by the editors of the Wall Street Journal. The Dow is computed using a price-weighted indexing system, rather than the more common market cap-weighted indexing system.
This research material has been prepared by LPL Financial LLC.
To the extent you are receiving investment advice from a separately registered independent investment advisor, please note that LPL Financial LLC is not an affiliate of and makes no representation with respect to such entity.
Not FDIC/NCUA Insured | Not Bank/Credit Union Guaranteed | May Lose Value | Not Guaranteed by any Government Agency | Not a Bank/Credit Union Deposit
Securities and Advisory services offered through LPL Financial LLC, a Registered Investment Advisor
Member FINRA/SIPC
Tracking # 1-652891 (Exp. 10/18)
Copyright © LPL Research


