by Ryan Detrick, LPL Research
One of the most popular trading axioms is to “sell in May and go away,” as equity returns historically have been relatively poor during the six months from May to October and much better from November through April. Is it true? On the surface, it is. From 1950* until last year, the S&P 500 Index during the May-until-October period was up only 1.4% on average, while it was up an average 7.0% the other six months.
Here’s the catch though: Performance during the “worst six months” has still been higher in four of the past five years, and the only drop was a minimal 0.3% decline in 2015. The average jump from May until October during the past five years has been a rather respectable 4.1%, and this isn’t even mentioning the S&P 500 in May has been higher during seven of the past 10 years. Of course, the average return in May over the past decade has been flat due to the 8.2% drop in 2010 and the Flash Crash.
Per Ryan Detrick, Senior Market Strategist, “We all know about the old adage “sell in May,” and performance justifies it to an extent, but it isn’t perfect. Had you sold in the beginning of May over the past five years and not reinvested until October, you left significant profits on the table. What stands out more are the summer months that followed, which tended to be much more volatile – who could forget Brexit last June or the China-currency-induced August 2015 correction? So be on the lookout for spikes in volatility during the next few months, but with the U.S. economy on firm footing, we’d use weakness to add to positions.”
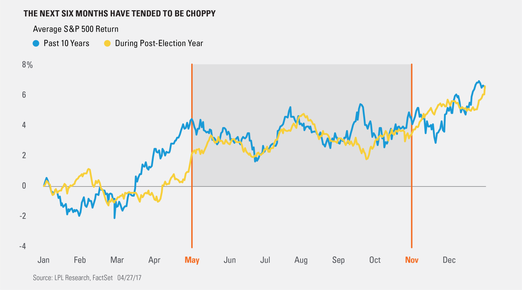
The chart below shows the average daily performance over the past 10 years and all post-election years since 1950. Peaks sometime in May have been common and a choppy range has tended to persist until the standard year-end rally.
We will take a much closer look at “Sell in May” in next week’s Weekly Economic Commentary and future blog posts.
IMPORTANT DISCLOSURES
* Please note: The modern design of the S&P 500 stock index was first launched in 1957. Performance back to 1950 incorporates the performance of predecessor index, the S&P 90.
Past performance is no guarantee of future results. All indexes are unmanaged and cannot be invested into directly. The opinions voiced in this material are for general information only and are not intended to provide or be construed as providing specific investment advice or recommendations for any individual security.
The economic forecasts set forth in the presentation may not develop as predicted.
Investing in stock includes numerous specific risks including: the fluctuation of dividend, loss of principal and potential illiquidity of the investment in a falling market.
Stock investing involves risk including loss of principal.
The Standard & Poor’s 500 Index is a capitalization-weighted index of 500 stocks designed to measure performance of the broad domestic economy through changes in the aggregate market value of 500 stocks representing all major industries.
This research material has been prepared by LPL Financial LLC.
To the extent you are receiving investment advice from a separately registered independent investment advisor, please note that LPL Financial LLC is not an affiliate of and makes no representation with respect to such entity.
Not FDIC/NCUA Insured | Not Bank/Credit Union Guaranteed | May Lose Value | Not Guaranteed by any Government Agency | Not a Bank/Credit Union Deposit
Securities and Advisory services offered through LPL Financial LLC, a Registered Investment Advisor Member FINRA/SIPC
Tracking #1-603767 (Exp. 4/18)
Copyright © LPL Research


