Market Ethos: Indexing Bias
by Derek Benedet, CMT & Craig Basinger, CFA, Connected Wealth, RichardsonGMP
Behavioral Finance combines behavioral and cognitive psychology theory with conventional economics and finance. Essentially it attempts to account or add the “human” element into understanding how the markets behave. While still a relative new area, it has garnered a great amount of attention. The most common aspects of this discipline are behavioral biases, such as loss aversion, framing, overconfidence, anchoring, recency, overreaction, etc. Many publications are devoted to helping investors understanding these biases to avoid their negative impact on performance.
 At Connected Wealth we are taking this one step further. The team is currently researching not only the various biases in the real world but working on investment strategies that take advantage of these biases. In the coming months we will be publishing on various aspects of this work and we welcome any feedback.
Indexing Bias
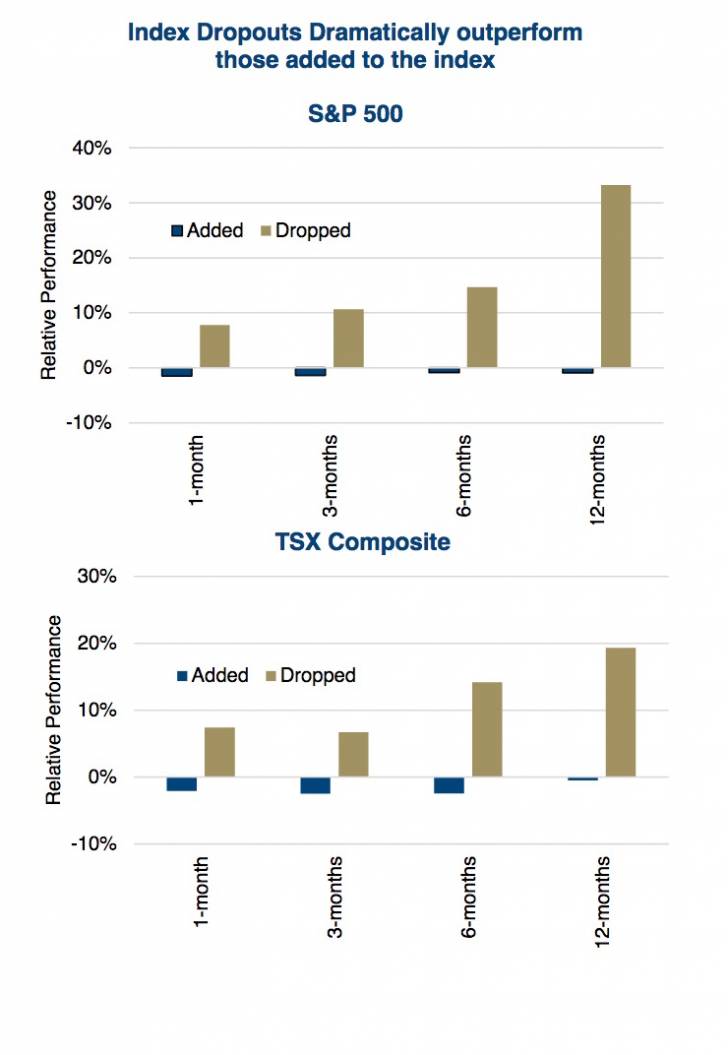
You won’t find this bias in any of the research or books on behavioral finance, we are inventing a new one. Indexing Bias is how investors view a company once it has been added or deleted from an index. One would think that a company added to the S&P 500 or TSX Composite is good news and the near term prospects for a rising share price would be high. Conversely, being removed from an index does sound negative, almost like punishment. However, we have found a reversion which sees those added to the index underperforming those removed. The charts to the right measure average performance relative to the market following inclusion or deletion from the index. There is a substantial difference, with those dropped doing much better than those added.

The Analysis
Obtaining the historical information of constituency data was not as easy as expected. Indices do have greater turnover than many might expect, including acquisitions the number of companies being added and deleted from the index averaged almost 100 per year across both the TSX and S&P 500. Tracking down the historical component and the future returns took a lot of detective work. Going line by line for 15 years of market data retells a lot of memorable stock stories. Spectacular failures like Enron, WorldCom, Nortel, and Sino-Forest stand out like sore thumb. But there were also plenty of ‘what if’ opportunities for companies with bright futures ahead of them. Index add dates for Google (2006) and Amazon (2005) are but just two.
The period of analysis was from 2001 for the S&P 500 and 2003 for the TSX Composite. During these periods there were 774 changes to the S&P 500 and 507 changes to the TSX. For the analysis, we looked at the names that were added and dropped from the index and the subsequent 1, 3, 6 and 12 month relative performance to the index. The timing was from the day the stock was actually added or removed. A significant amount of the names removed from the index were due to being acquired, these were excluded from our analysis as those companies simply ceased to exist. As a result this analysis covers just companies added and those removed that were not subject to an acquisition.
The Results
The results were fairly surprising. As the two charts on page 1 show, the average performance of companies removed from the index were dramatically higher than for those companies added to the index. This does appear material, for both indices the dropped companies outperformed the added companies by almost 10% in the first month. And for both this outperformance was even higher for longer time periods.
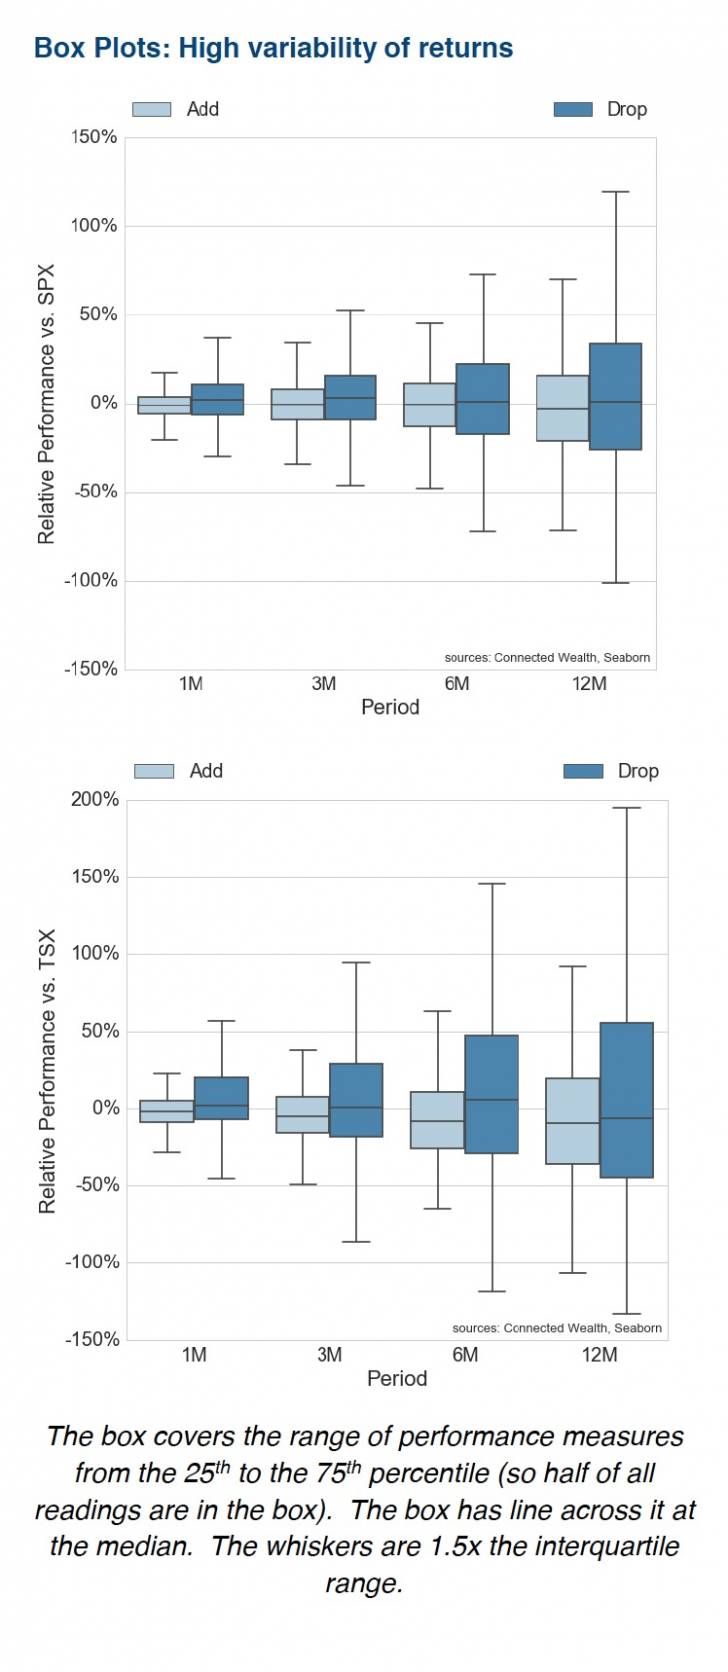
A lot can be hidden in average performance and the variance of returns was high (averages often hide more than they are telling). The charts on the top of this page are box plots which attempt to show how variable the returns were. For those cooler readers who may skipped stats class, we included a quick guide as to what you are looking at beneath the chart.

The ‘Dropped’ by the index group certainly experienced higher variability in performance. This does make sense, as some of those dropped from the index go bankrupt or really continue to fall quickly. While some also bounce back. The high degree of variability, which is more elevated in the ‘dropped’ group, does reduce the efficacy of the findings.
Box Plots: High variability of returns
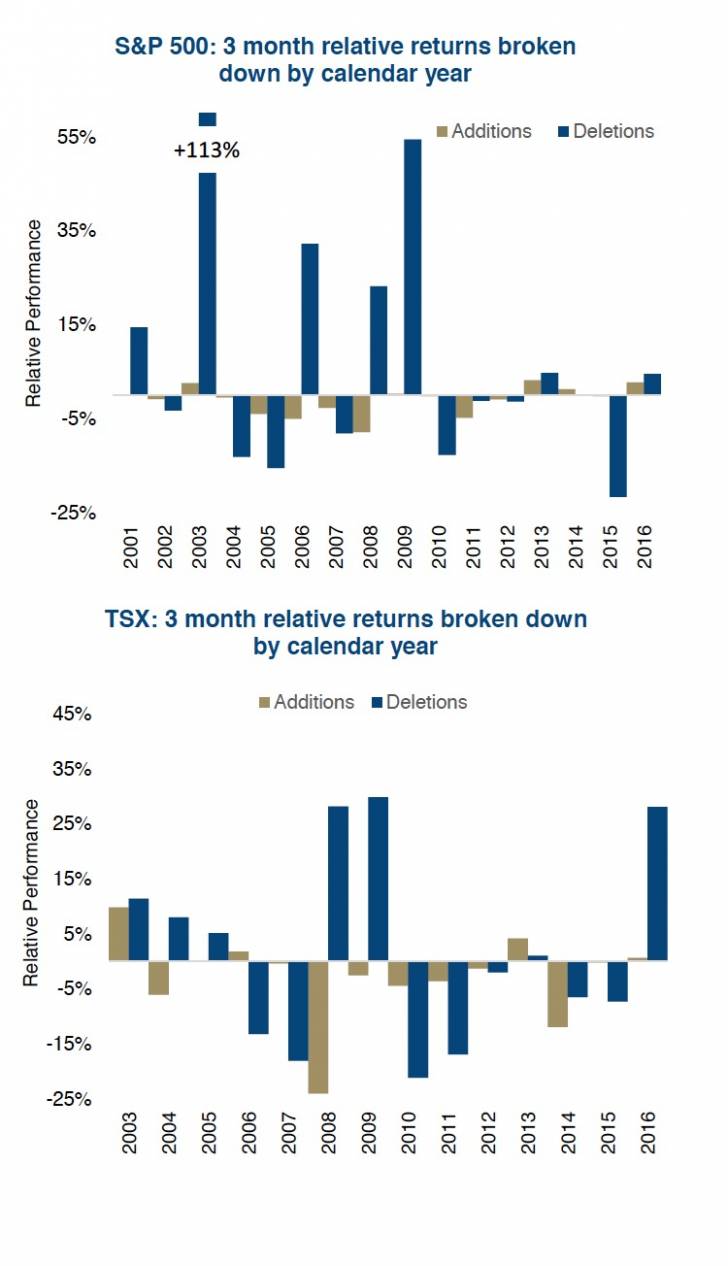
The two charts on this page break down the performance by calendar year. The success of one group over the other appears evenly split from a frequency perspective. But it is the outsized gains of the deletions that is most appealing.
Conclusions
While the variability of returns is high, there appears to be a performance edge that goes to the stocks removed from an index relative to those that have been added. We believe this comes from two factors, the rising amount of capital deployed in passive or index strategies and a natural mean reversion.
Index Changes and the role of ETFs – Markets are always changing and evolving, as are the participants. With the rise of ETFs, notably those straight forward passive strategies, more money is deployed mimicking the index. This does result in forced buying of added companies and forced selling of those removed. However, this is somewhat mitigated by the managers of the ETFs, who are not beholden to add or drop a position on a specific date. The managers will look for best execution from a market perspective with the goal of reducing tracking error. We would also add that when changes are happening they are being made on the margin, typically the lowest weights in an index so not holding the true basket would have a minimal impact on tracking error. Still, at some point there will be buying of new members and selling of dropped names.
Given the number of smart people in this industry, there is also a large amount of capital that attempts to front run the announcements. Everyone knows the smallest weighted company in the TSX today is Surge Energy, some are likely betting it will be removed. And finding the largest company not in the index is pretty easy too.
Mean Reversion – A company that is dropped from the index has likely suffered a material decline in the share price. Then the announcement the company is on the way out and it gets hit again with forced selling by index funds. This often occurs before the company is actually removed. Once removed from the index, some of these keep going to zero, but many bounce back as all that selling pressure abates, even if temporarily. As an example, Nortel bounced back after being removed from the index, up 100% after six months. It didn’t end well later, but there was at least a short term mean revision.
Conversely, companies that get added have often experienced strong price appreciation that lifted the market capitalization to a level worthy of inclusion in the index. Then some smart money bids it up more, the announcement hits and the share price goes up even more. Finally when the effective index inclusion date comes the shares have been bid too far and there is a downward mean revision.
Investment Implications
When you hear of an index change, don’t try and jump on the bandwagon as chances are the added name has already moved higher and the dropped name has moved lower.
Although, you may want to look at the companies being dropped, if bankruptcy is unlikely, it could be a buying opportunity, taking advantage of the Indexing Bias.
Recent names in Canada which were dropped were Avigilon and Concordia International Corp last September. Just so you truly understand the variability, Avigilon is up +79% and Concordia is down -70%. Those choosing to fish in the index dropped pond will need a very strong constitution.
******
Charts are sourced to Bloomberg unless otherwise noted.
This material is provided for general information and is not to be construed as an offer or solicitation for the sale or purchase of securities mentioned herein. Past performance may not be repeated. Every effort has been made to compile this material from reliable sources however no warranty can be made as to its accuracy or completeness. Before acting on any of the above, please seek individual financial advice based on your personal circumstances. However, neither the author nor Richardson GMP Limited makes any representation or warranty, expressed or implied, in respect thereof, or takes any responsibility for any errors or omissions which may be contained herein or accepts any liability whatsoever for any loss arising from any use or reliance on this report or its contents. Richardson GMP Limited is a member of Canadian Investor Protection Fund. Richardson is a trade-mark of James Richardson & Sons, Limited. GMP is a registered trade-mark of GMP Securities L.P. Both used under license by Richardson GMP Limited.
Copyright © Connected Wealth, RichardsonGMP


