


While a rising stock to bond ratio isn’t all that surprising, especially in a bull market, the recent acceleration is not commonplace. Over the last two quarters stocks have outperformed bonds by 31%, which is highest level since 2011. Only in 1999 did stocks outperform bonds by a wider wide margin over a two quarter period.
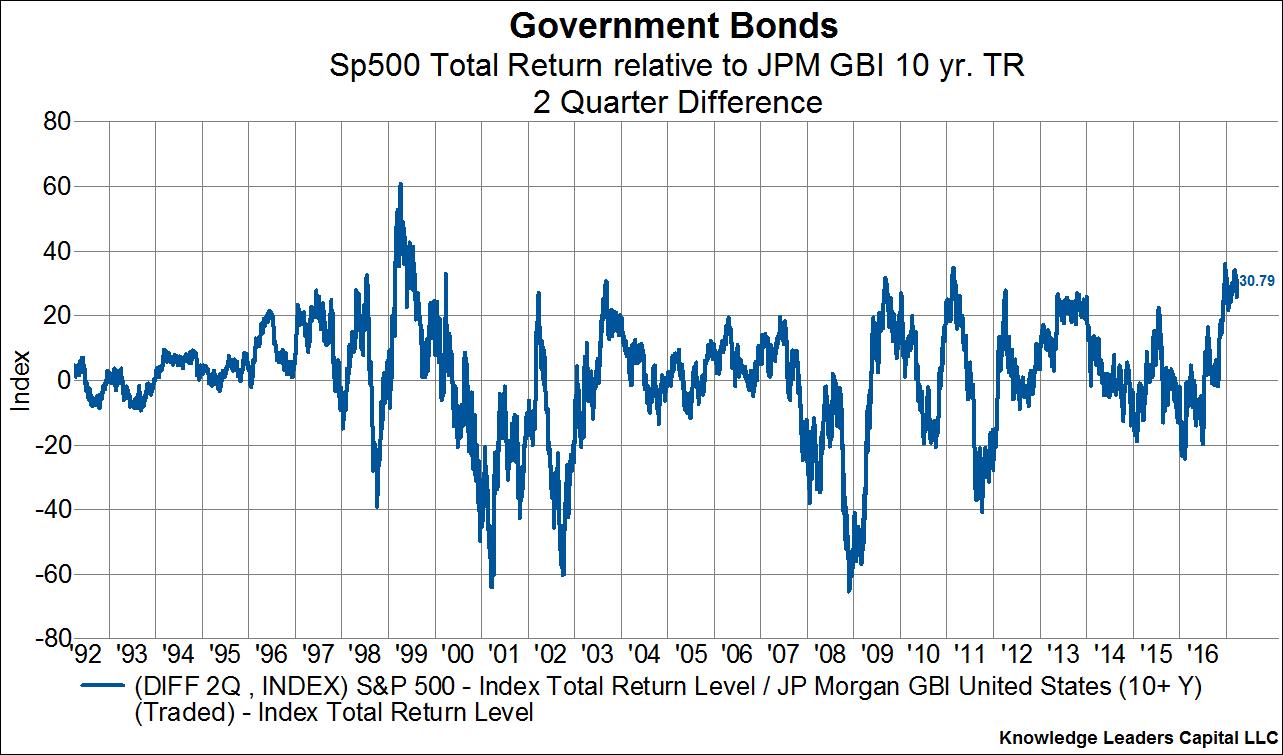
So what does this simple chart tell us? Over short periods of time, the relative performance of stocks and bonds fluctuates around around a mean of about zero. When stocks outperform bonds by a large amount over a short period, that period of outperformance reverts back towards zero, either through time or performance. While we can’t possibly predict the performance of either stocks or bonds, what we can fairly confidently deduce is that further stock strength relative to bonds is unlikely over the coming months.
Copyright ©