by Don Vialoux, Timingthemarket.ca
Observations
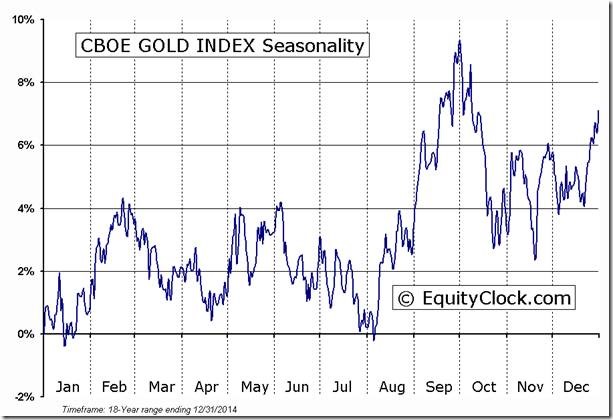
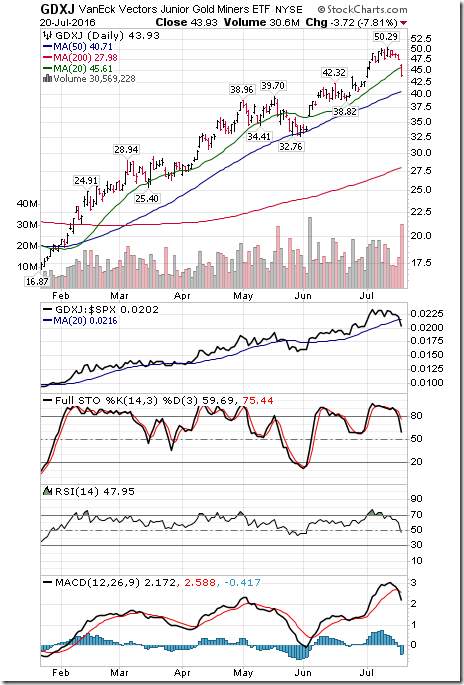
Precious metal equities have been under pressure recently. That’s normal for this time of year. They tend to weaken briefly into late July/early August where they have a history of reaching a significant intermediate low. Preferred strategy is to watch for an upturn in short term momentum indicators for a buy signal as the sector enters into its period of seasonal strength. Currently, Stochastic, RSI and MACD are trending down.
StockTwits Released Yesterday @EquityClock
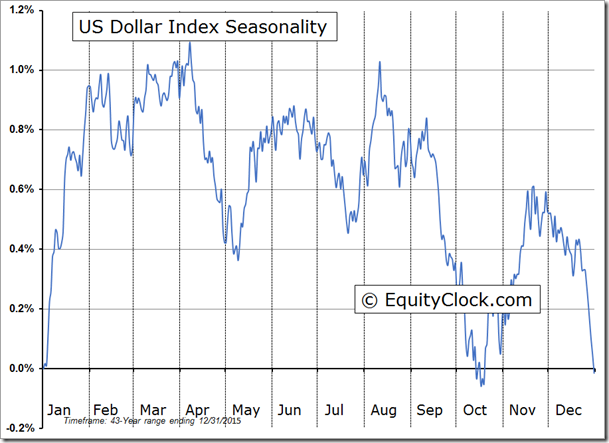
US Dollar Index breaks above a flag pattern as seasonal tendencies turn positive.
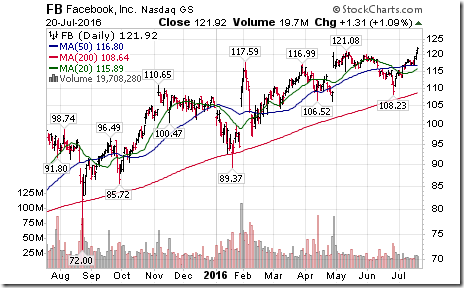
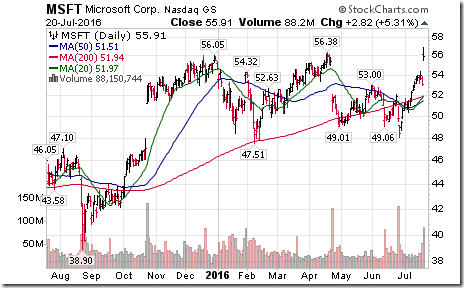
Technical action by S&P 500 stocks to 10:30: Quietly bullish: Breakouts: $HD, $THC, $KSU, $FB, $GOOG, $DNB. Breakdowns: $FAST, $NBR
Editor’s Note: After 10:30 AM EDT, additional breakouts included Amphenol, Expedia, Mohawk Industries, Morgan Stanley, Mylan Labs, Nielsen and Total Systems Services.
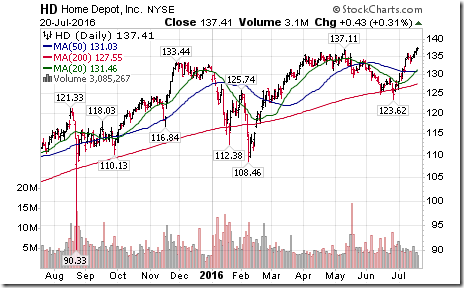
Nice breakout by Home Depot $HD above $137.11 reaching an all-time high extending an intermediate uptrend
Nice breakout by Facebook $FB above $121.08 reaching an all-time high extending an intermediate uptrend
Nice breakout by Microsoft $MSFT above $56.38 reaching an all-time high extending an intermediate uptrend.
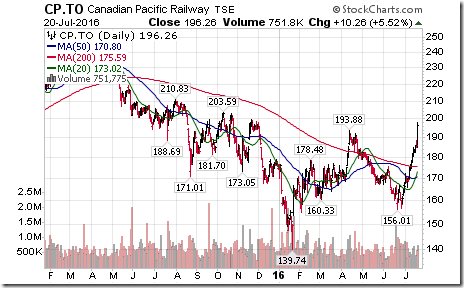
Nice breakout by Cdn. Pacific $CP.CA above $193.88 Cdn.extending an intermediate uptrend.
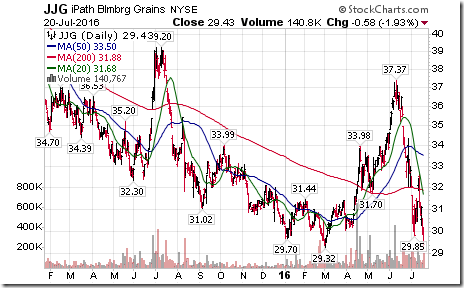
Grain ETN $JJG broke support at $29.32 reaching all-time low. Also breaking down: $CORN, $WEAT, $SOYB.
Trader’s Corner
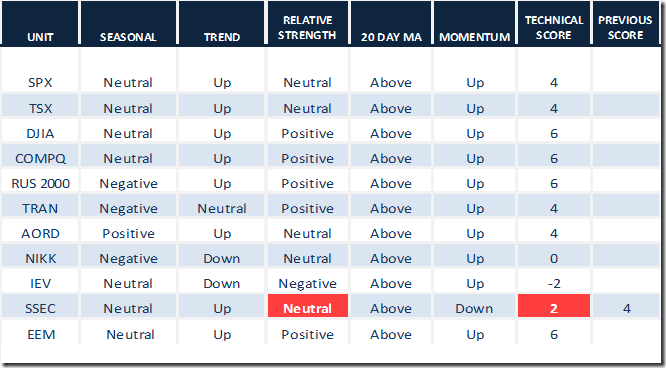
Daily Seasonal/Technical Equity Trends for July 20th 2016
Green: Increase from previous day
Red: Decrease from previous day
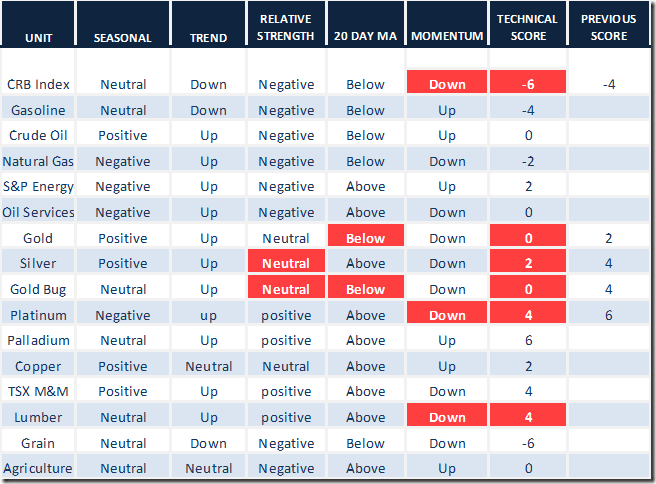
Daily Seasonal/Technical Commodities Trends for July 20th 2016
Green: Increase from previous day
Red: Decrease from previous day
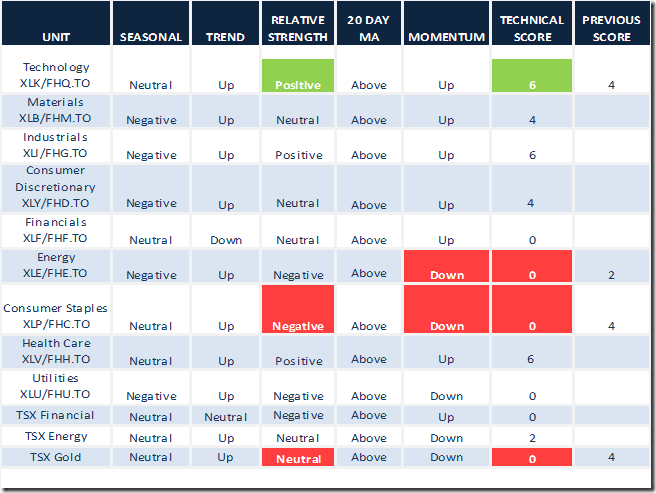
Daily Seasonal/Technical Sector Trends for March July 20th 2016
Green: Increase from previous day
Red: Decrease from previous day
Special Free Services available through www.equityclock.com
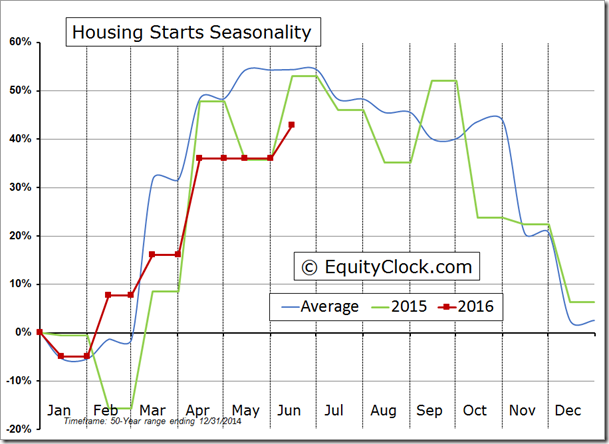
Equityclock.com is offering free access to a data base showing seasonal studies on individual stocks and sectors. The data base holds seasonality studies on over 1000 big and moderate cap securities and indices. To login, simply go to http://www.equityclock.com/charts. Following is an example:
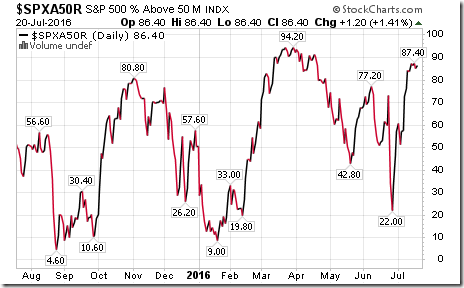
S&P Momentum Barometer
The Barometer added 1.20 (1.41%) to 86.40 yesterday. It remains intermediate overbought and showing short term signs of peaking
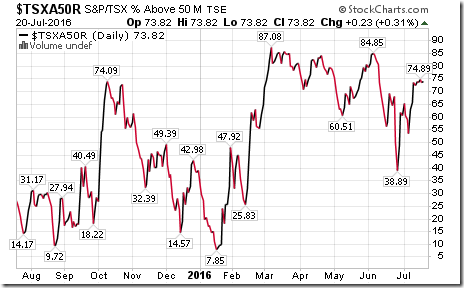
TSX Composite Momentum Barometer
The Barometer added 0.23 (0.31%) to 73.82 yesterday. It remains intermediate overbought and showing early short term signs of peaking.
Disclaimer: Seasonality and technical ratings offered in this report by www.timingthemarket.ca and www.equityclock.com are for information only. They should not be considered as advice to purchase or to sell mentioned securities. Data offered in this report is believed to be accurate, but is not guaranteed
Copyright © DV Tech Talk, Timingthemarket.ca


