by Don Vialoux, Timingthemarket.ca
Observations
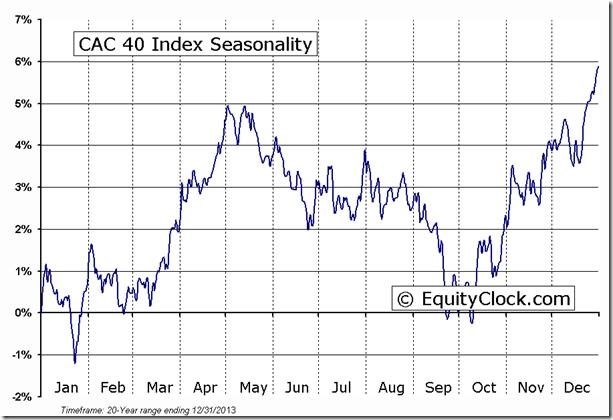
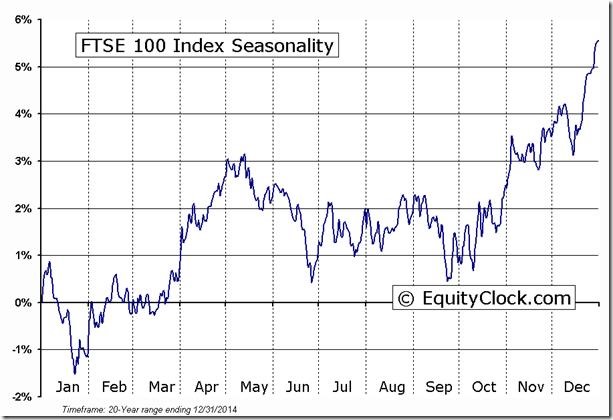
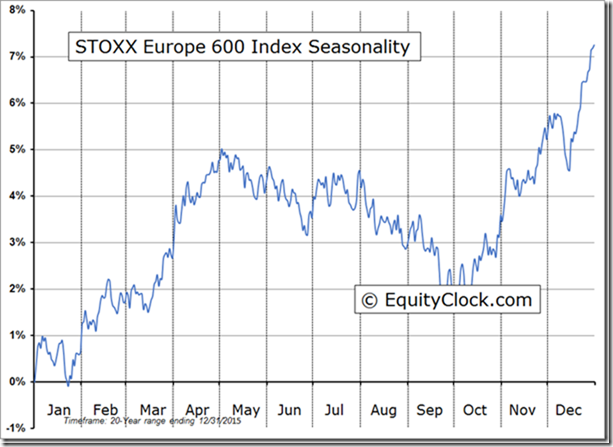
Another “risk on” day with significant short term technical deterioration! Notable were breakdowns by major European equity indices due to growing Brexit concerns and a spike by the VIX Index. As a friend of Tech Talk observed over the weekend, the equity strategy “Sell in June and avoid the swoon” is working well this year.
StockTwits Released Yesterday @EquityClock
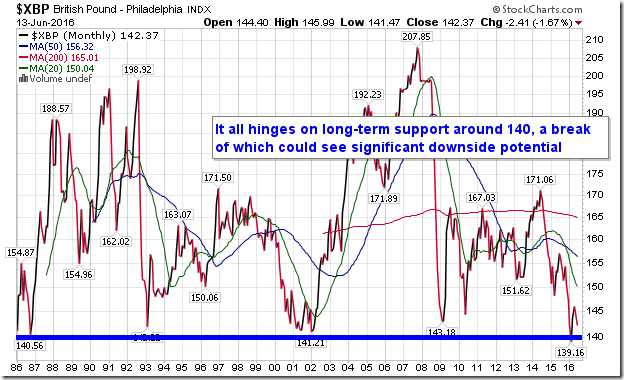
As Brexit vote nears, British Pound hinges on the 30 year level of support.
Technical action by S&P 500 stocks to 10:00: Bearish. Breakdowns: $GM, $OMC, $BAC, $STT, $GWW, $SNA, $DAL, $FAST, $FB. No breakouts.
Editor’s Note: After 10:00 AM, HBI and IVZ broke support
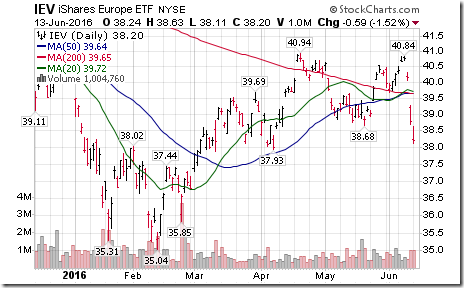
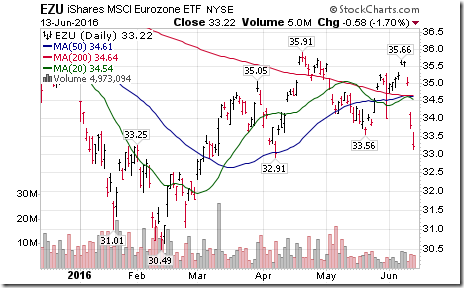
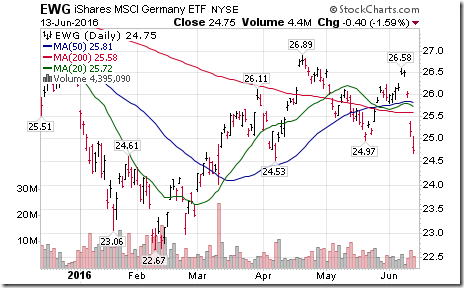
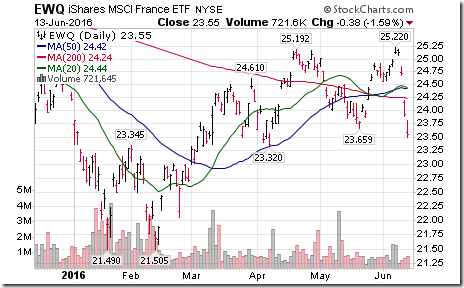
Europe based ETFs break support completing double top patterns: $IEV, $EZU, $EWG, $EWQ
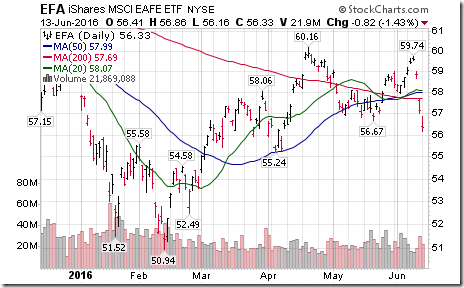
Weakness in Far East as well as European equities triggered completion of double top pattern by $EFA.
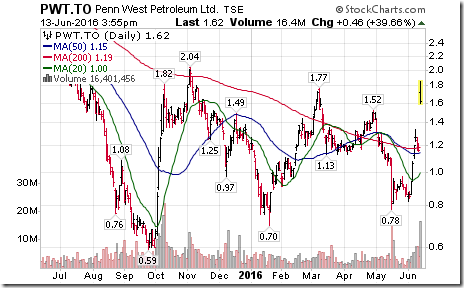
Sale of Penn West’s Saskatchewan assets for $975 million triggered the breakout.
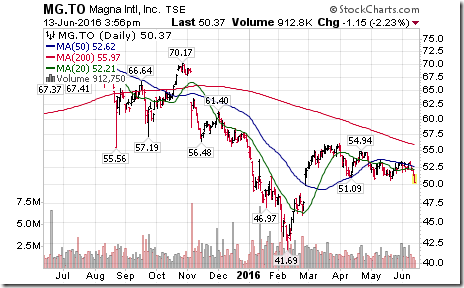
Magna Int’l $MG.CA broke support at $50.61 to establish new downtrend.
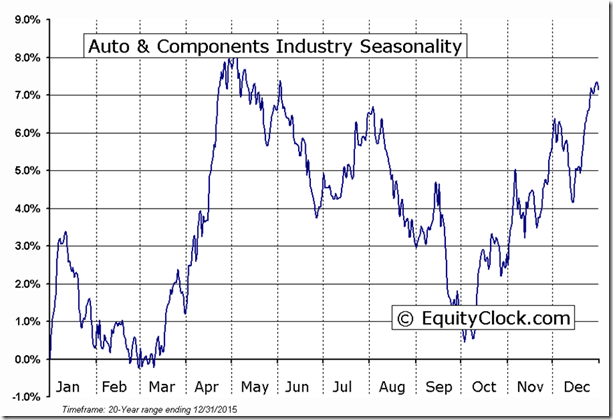
‘Tis the season for auto and component stocks to move lower to early October!
Interesting Charts
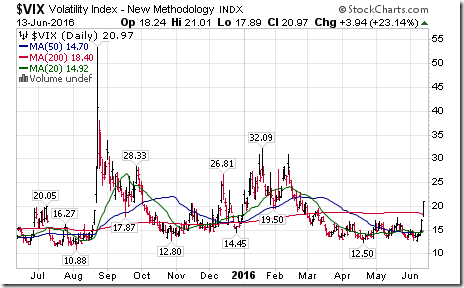
Growing Brexit fears plus projected Fed comments spiked the VIX Index above the 20% level.
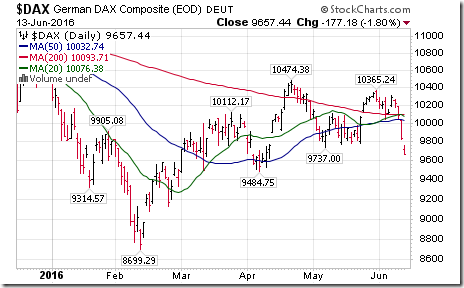
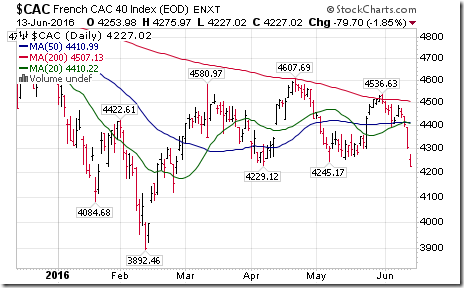
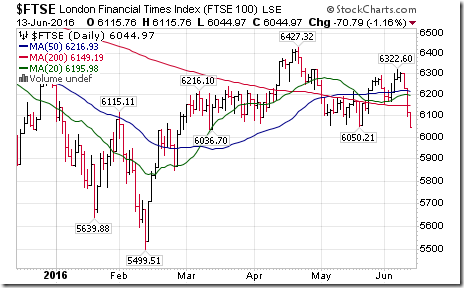
The Frankfurt DAX Index, Paris CAC Index and London FT Index simultaneously broke below indicated support levels. The DAX Index closed below 9,737.00, the CAC Index closed below 4,245. 17 and the FTSE closed below 6,050.21
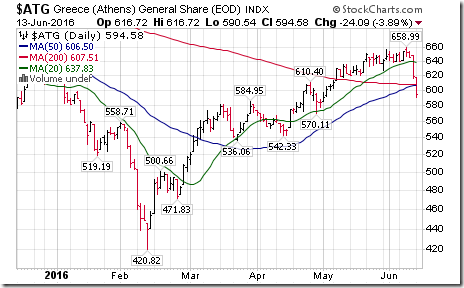
Hardest hit in Europe was Greece’s equity index.
Trader’s Corner
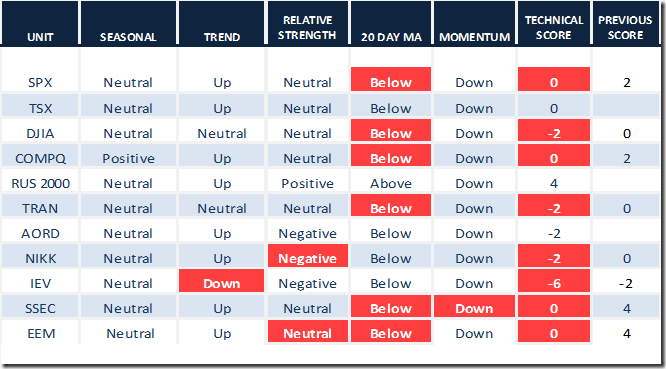
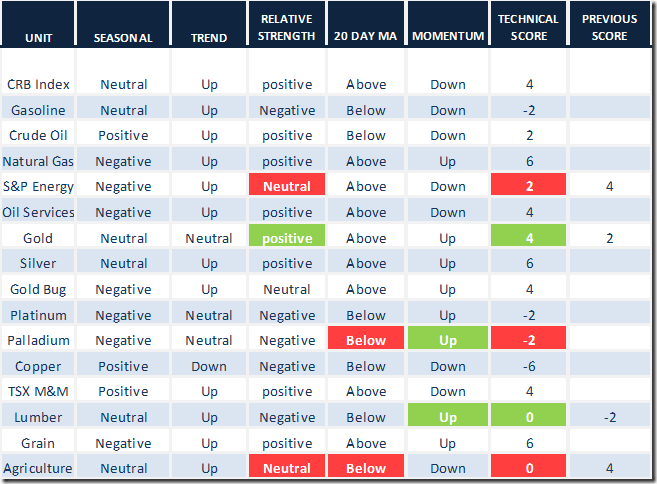
Significant technical deterioration continued yesterday with many indices, commodities and sectors dropping below their 20 day moving average
Daily Seasonal/Technical Equity Trends for June 13th 2016
Green: Increase from previous day
Red: Decrease from previous day
Daily Seasonal/Technical Commodities Trends for June 13th 2016
Green: Increase from previous day
Red: Decrease from previous day
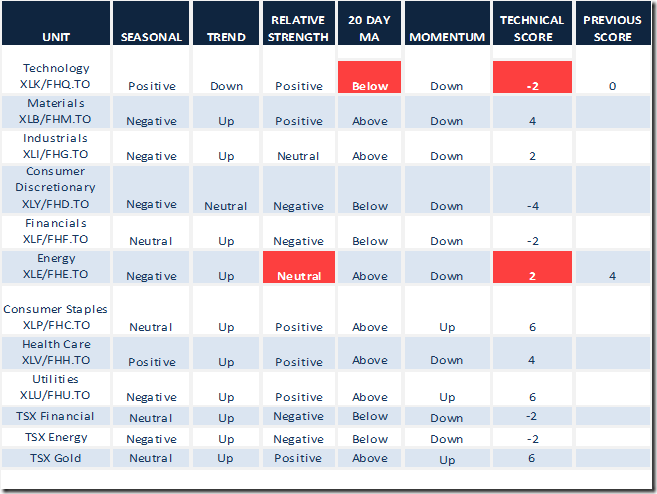
Daily Seasonal/Technical Sector Trends for March June 13th 2016
Green: Increase from previous day
Red: Decrease from previous day
Special Free Services available through www.equityclock.com
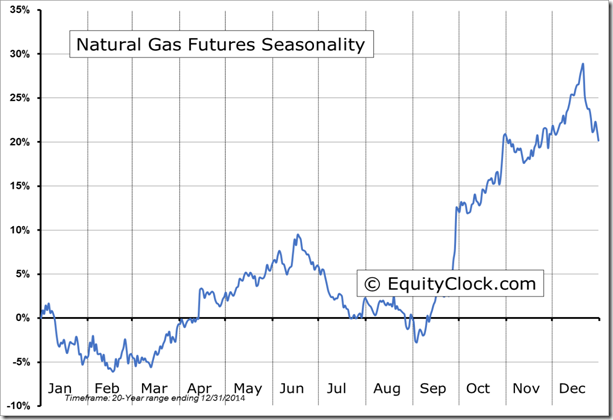
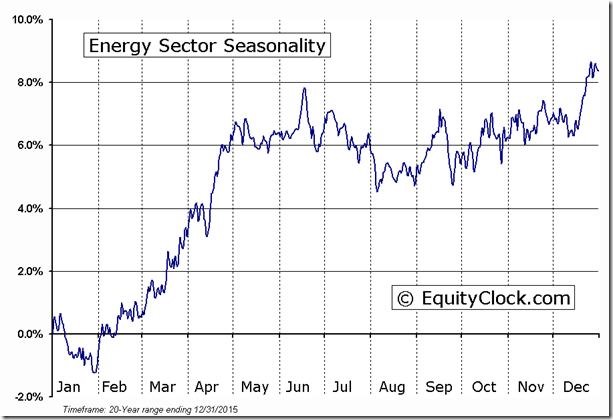
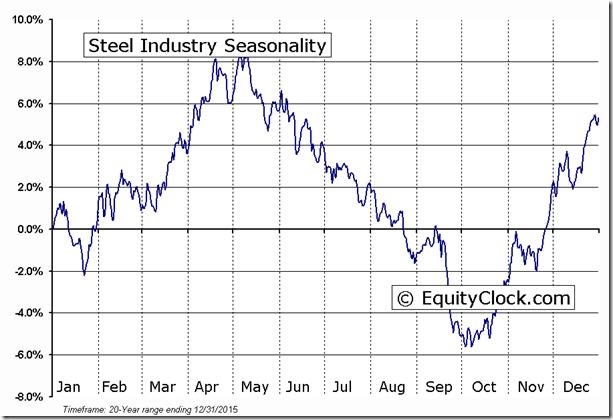
Equityclock.com is offering free access to a data base showing seasonal studies on individual stocks and sectors. The data base holds seasonality studies on over 1000 big and moderate cap securities and indices. To login, simply go to http://www.equityclock.com/charts/ Following are examples:
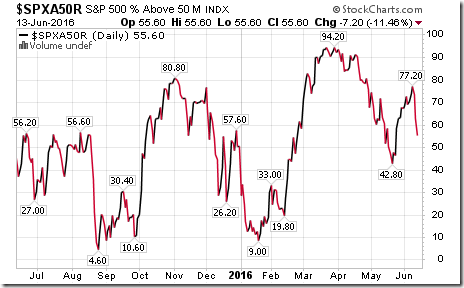
S&P Momentum Barometer
The Barometer dropped another 7.20 to 55.60. The Barometer remains intermediate overbought and in a short term downtrend.
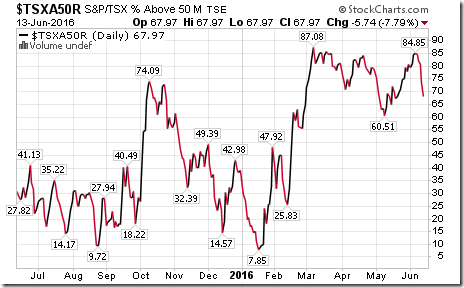
TSX Momentum Barometer
The Barometer dropped another 5.74 to 67.97 . The Barometer remains intermediate overbought and in a short term downtrend
Disclaimer: Seasonality and technical ratings offered in this report by www.timingthemarket.ca and www.equityclock.com are for information only. They should not be considered as advice to purchase or to sell mentioned securities. Data offered in this report is believed to be accurate, but is not guaranteed
Copyright © DV Tech Talk, Timingthemarket.ca


