by Don Vialoux, Timingthemarket.ca
Economic News This Week
May Retail Sales to be released at 8:30 AM EDT on Tuesday are expected to increase 0.3% versus a gain of 1.3% in April. Excluding auto sales, May Retail Sales are expected to increase 0.4% versus a gain of 0.8% in April
April Business Inventories to be released at 10:00 AM EDT on Tuesday are expected to increase 0.2% versus a gain of 0.4% in March.
May Producer Prices to be released at 8:30 AM EDT on Wednesday are expected to increase 0.3% versus a gain of 0.2% in April. Excluding food and energy, May Producer Prices are expected to increase 0.1% versus a gain of 0.1% in April.
June Empire State Manufacturing Index to be released at 8:30 AM EDT on Wednesday is expected to improve to -4.7 from -9.0 in May.
May Industrial Production to be released at 9:15 AM EDT on Wednesday is expected to slip 0.2% versus a gain of 0.7% in April. May Capacity Utilization is expected to slip to 75.2% from 75.4% in April
FOMC Decision on the Fed Fund rate to be released at 2:00 PM EDT on Wednesday is expected to maintain the rate at 0.25%-0.50%.
May Consumer Prices to be released at 8:30 AM EDT on Thursday are expected to increase 0.3% versus a gain of 0.4% in April. Excluding food and energy, May Consumer Prices are expected to increase 0.2% versus a gain of 0.2% in April
June Philadelphia Fed Index to be released at 8:30 AM EDT on Thursday is expected to improve to 1.2 from -1.8 in May.
May Housing Starts to be released at 8:30 AM EDT on Friday are expected to slip to 1,155,000 units from 1,172,000 units in April
May Canadian Consumer Prices to be released at 8:30 AM EDT on Friday are expected to increase 0.6% (1.6% year-over-year) versus a gain of 0.3% in April. Excluding food and energy, May CPI is expected to increase 0.2% (2.0% year-over-year) versus a gain of 0.2% in April
Earnings News This Week
Thursday: Oracle, Red Hat, Kroger
The Bottom Line
World equity markets and most economic sensitive sectors recorded an important inflection point on Friday. Short and intermediate downside risk exceeds upside potential between now and U.S. Presidential Election Day (November 8th). Traders following seasonal strategy should respond accordingly.
Observations
Economic focus this week is on the FOMC meeting on Wednesday. Consensus is that the Fed will maintain the Fed Fund rate at 0.25%-0.50%, but will give supporting evidence for another 0.25% increase at report from its next meeting on July 27th. Traders also will watch the May PPI and CPI reports for hints of acceleration in inflation.
Earnings reports are not relevant this week. Oracle is in the spotlight.
Anticipation of second quarter results is unlikely to help North American equity prices during the next month. Consensus for S&P 500 companies calls for a drop of 4.9% in earnings and a decline of 0.8% in sales on a year-over-year basis.
Beyond second quarter results, prospects for S&P 500 companies turn more positive. According to FactSet, third quarter earnings on a year-over-year basis are expected to increase 1.4% and sales are expected to improve 2.2%. Fourth quarter earnings on a year-over-year basis are expected to increase 7.6% and sales are expected to increase 5.0%.
Short term momentum indicators for most world equity indices and economic sensitive sectors turned lower on Friday from overbought levels.
Medium term technical indicators (e.g. Equity index barometers) for major equity indices showed signs of rolling over from intermediate overbought levels.
Average optimal day during the past 20 years for the S&P 500 Index to reach a seasonal peak is June 10th and average optimal day for the TSX Composite Index to reach a seasonal peak is June 4th. Given the short and intermediate level of both equity markets, chances are high that the optimal day this year was reached last week.
A study by EquityClock on performance of the S&P 500 Index in the month of June since 1966 shows an average gain per period from June 1st to June 17th of 0.56% with positive returns recorded 62.0% of the time. Performance from June 17th to end of the month recorded a loss of 0.50% with negative returns realized 56.0% of the time.
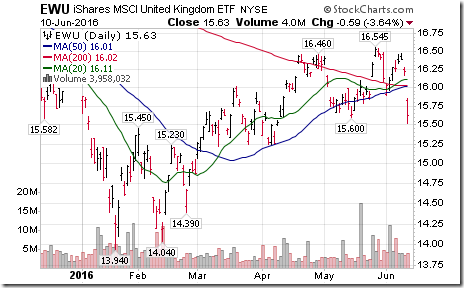
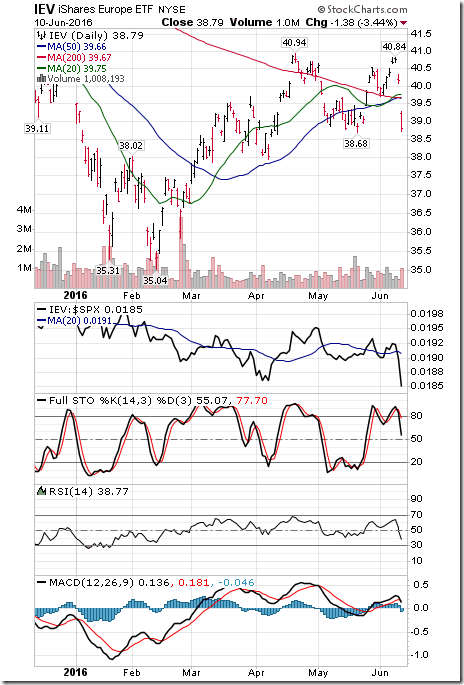
“Brexit” is becoming a significant issue for equity markets. A poll released on Friday implied a higher chance that the United Kingdom will vote to leave the European Common Market in its June 23rd referendum. European equity markets quickly responded with iShares for several European country breaking support levels.
Technical action by individual S&P 500 stocks turned significantly bearish late last week. DJIA stocks breaking support included Goldman Sachs, Home Depot and Walt Disney.
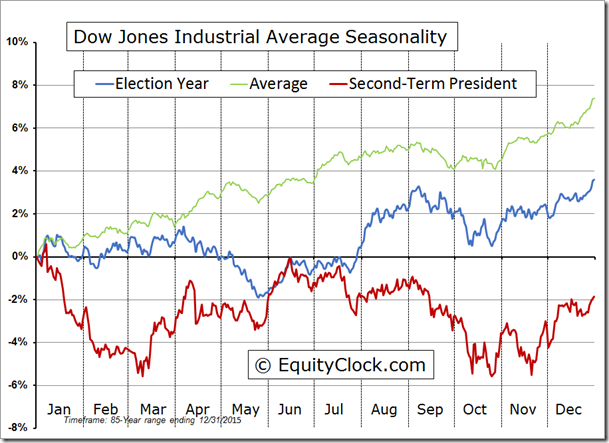
The Dow Jones Industrial Average during a Presidential election year after a second term President has a history of reaching a seasonal peak in mid-June.
Equity Indices and Related ETFs
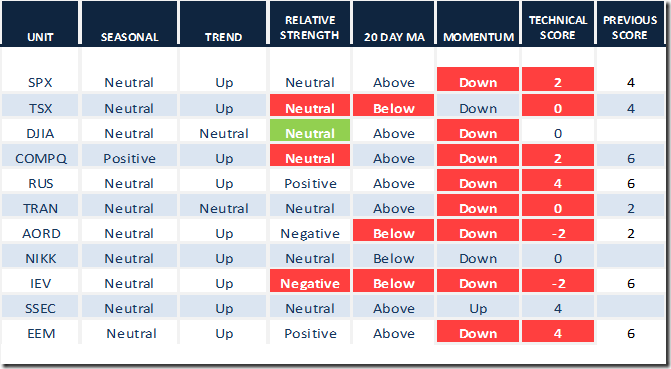
Daily Seasonal/Technical Equity Trends for June 10th 2016
Green: Increase from previous day
Red: Decrease from previous day
Calculating Technical Scores
Technical scores are calculated as follows:
Intermediate Uptrend based on at least 20 trading days: Score 2
Higher highs and higher lows
Intermediate Neutral trend: Score 0
Not up or down
Intermediate Downtrend: Score -2
Lower highs and lower lows
Outperformance relative to the S&P 500 Index: Score: 2
Neutral Performance relative to the S&P 500 Index: 0
Underperformance relative to the S&P 500 Index: Score –2
Above 20 day moving average: Score 1
At 20 day moving average: Score: 0
Below 20 day moving average: –1
Up trending momentum indicators (Daily Stochastics, RSI and MACD): 1
Mixed momentum indicators: 0
Down trending momentum indicators: –1
Technical scores range from -6 to +6. Technical buy signals based on the above guidelines start when a security advances to at least 0.0, but preferably 2.0 or higher. Technical sell/short signals start when a security descends to 0, but preferably -2.0 or lower.
Long positions require maintaining a technical score of -2.0 or higher. Conversely, a short position requires maintaining a technical score of +2.0 or lower.
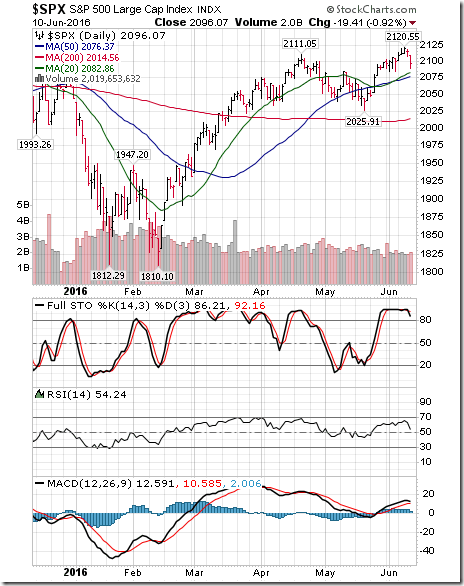
The S&P 500 Index slipped 3.06 points (0.15%) last week. Intermediate trend remains up. The Index remains above its 20 day moving average. Short term momentum indicators changed on Friday to down from up
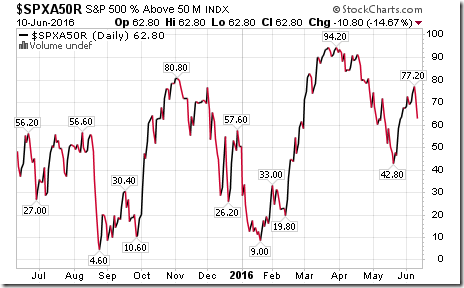
Percent of S&P 500 stocks trading above their 50 day moving average (Also known as the Momentum Barometer) dropped last week to 62.80% from 69.00% with more than all of the decline occurring on Friday. Percent remains intermediate overbought and trending down.
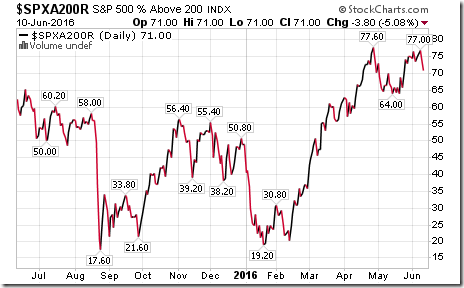
Percent of S&P 500 stocks trading above their 200 day moving average dropped last week to 71.00% from 73.60%. Percent remains intermediate overbought and trending down.
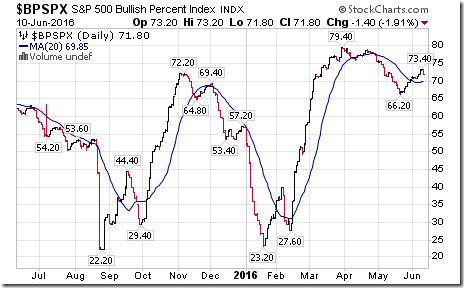
Bullish Percent Index for S&P 500 stocks increased last week to 71.80% from 70.80% and remained above its 20 day moving average. The Index remains intermediate overbought.
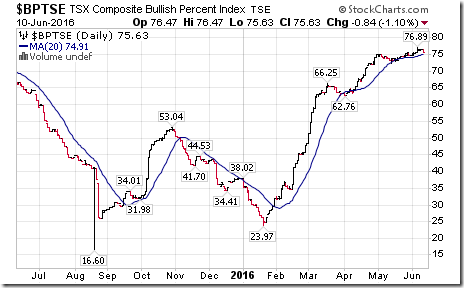
Bullish Percent Index for TSX Composite stocks was unchanged last week and remained above its 20 day moving average. The Index remains intermediate overbought.
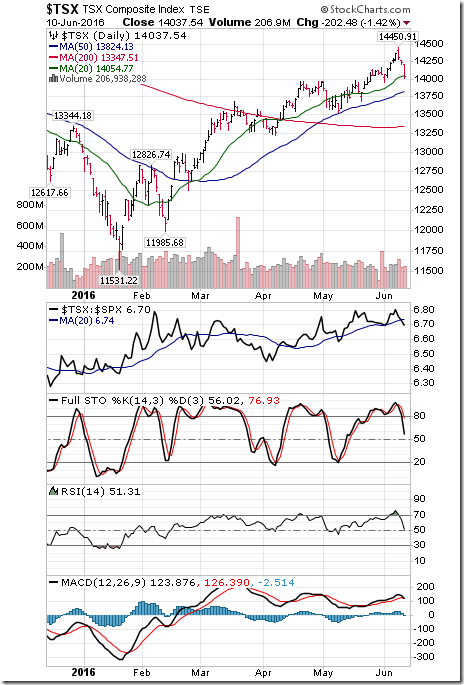
The TSX Composite Index dropped 189.24 points (1.33%) last week. Intermediate trend remains up (Score: 2). Strength relative to the S&P 500 Index changed on Friday to neutral from positive (Score: 0). The Index dropped below its 20 day moving average on Friday (Score: -1). Short term momentum indicators are trending down (Score: -1). Technical score dropped last week to 0 from 6.
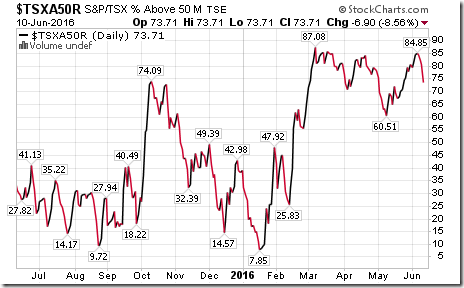
Percent of TSX stocks trading above their 50 day moving average (Also known as the Momentum Barometer) plunged last week to 73.71% from 84.42%. Percent remains intermediate overbought and trending down.
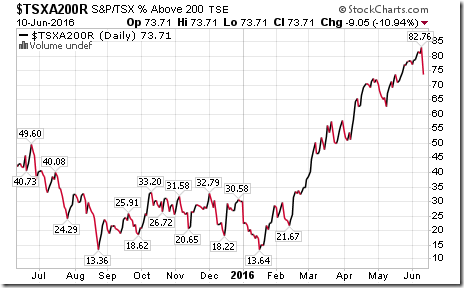
Percent of TSX stocks trading above their 200 day moving average dropped last week to 73.71% from 78.79%. Percent remains intermediate overbought and is trending down.
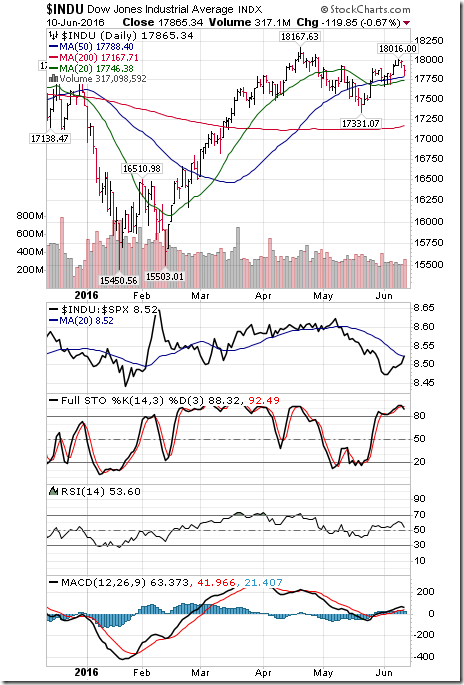
The Dow Jones Industrial Average added 58.21 points (0.33%) last week. Intermediate trend remains neutral. Strength relative to the S&P 500 Index changed to neutral from negative. The Average remained above its 20 day moving average. Short term momentum indicators have started to turn down. Technical score improved last week to 0 from -2
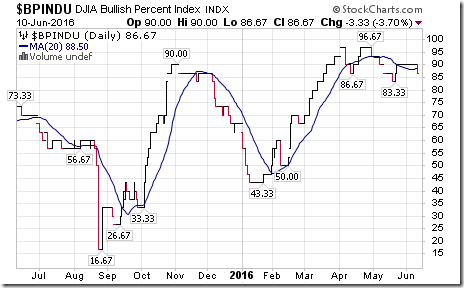
Bullish Percent Index for Dow Jones Industrial Average stocks slipped last week to 86.67% from 90.00% and dropped below its 20 day moving average. The Index remains intermediate overbought and has started to turn down.
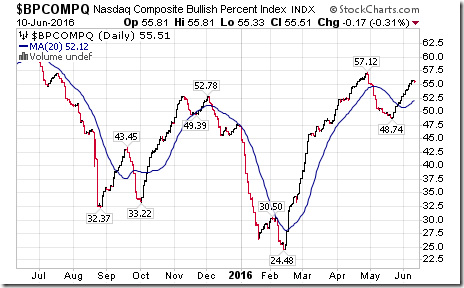
Bullish Percent Index for NASDAQ Composite Index increased last week to 55.51% from 53.95% and remained above its 20 day moving average. The Index remains intermediate overbought.
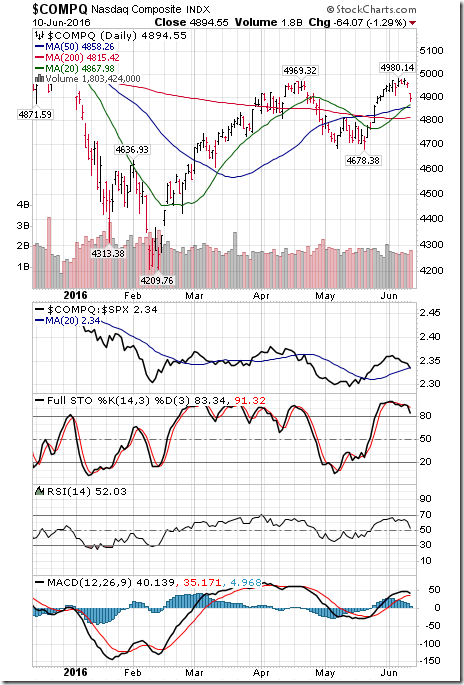
The NASDAQ Composite Index dropped 47.97 points (0.98%) last week. Intermediate trend remains up. Strength relative to the S&P 500 Index changed to neutral from positive. The Index remains above its 20 day moving average. Short term momentum indicators turned down on Friday. Technical score dropped last week to 2 from 6.
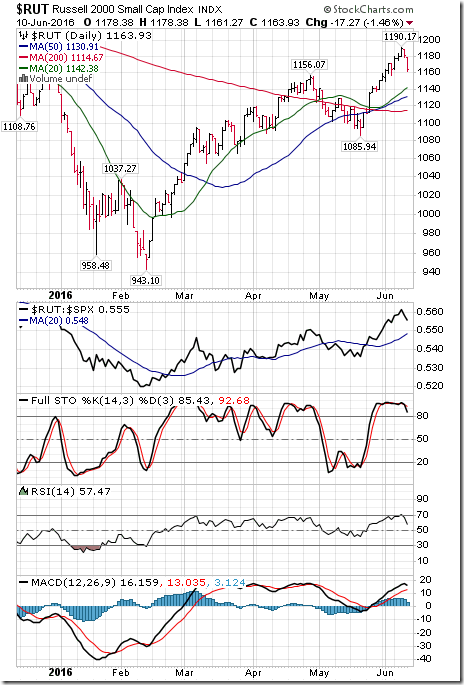
The Russell 2000 Index slipped 0.20 (0.02%) last week. Intermediate trend remains up. Strength relative to the S&P 500 Index remains positive. The Index remains above its 20 day moving average. Short term momentum indicators turned down on Friday
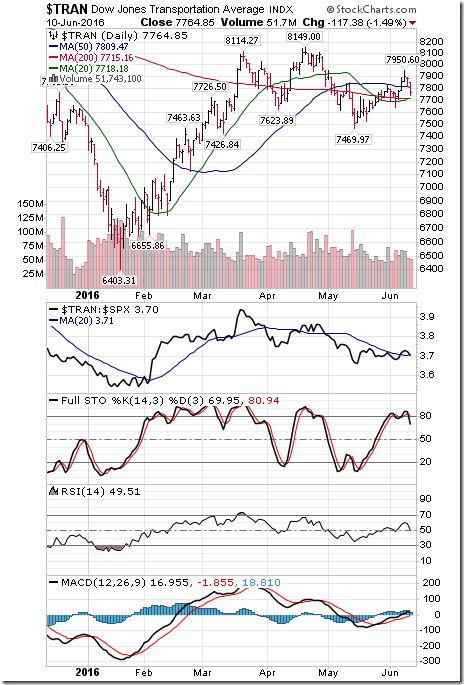
The Dow Jones Transportation Average added 34.66 points (0.45%) last week. Intermediate trend remains neutral. Strength relative to the S&P 500 Index improved last week to neutral from negative. The Average moved above its 20 day moving average. Short term momentum indicators turned down on Friday. Technical score improved last week to 0 from -2.
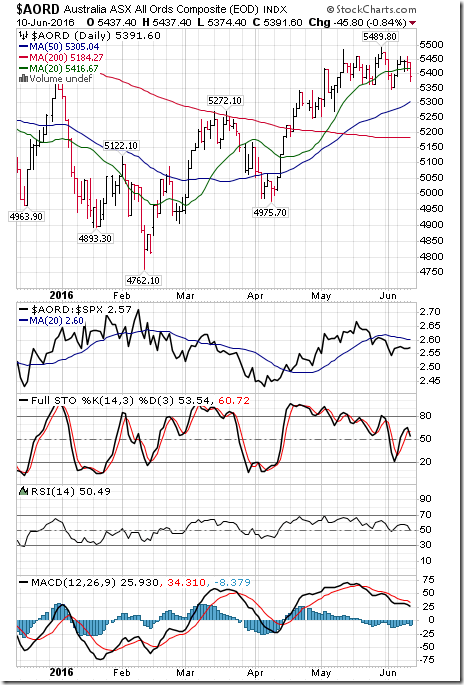
The Australia All Ordinaries Composite Index slipped 0.90 (0.02%) last week. Intermediate trend remains up. Strength relative to the S&P 500 Index remained negative. The Index remained below its 20 day moving average. Short term momentum indicators are trending down. Technical score remained last week at -2.
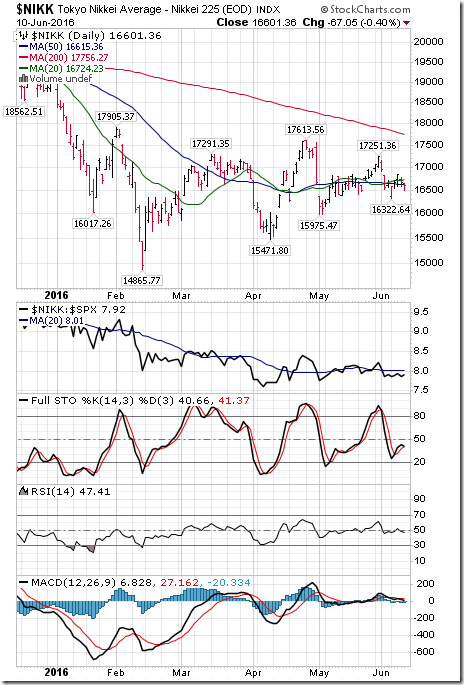
The Nikkei Average dropped 40.87 points (0.25%) last week. Intermediate trend remains up. Strength relative to the S&P 500 Index remains neutral. The Average remained below its 20 day moving average. Short term momentum indicators are trending down. Technical score remained last week at 0.
Europe iShares plunged $1.47 (3.65%) last week with all of the drop occurring on Friday (Looming Brexit fears). Intermediate trend remains up. Strength relative to the S&P 500 Index changed to negative from neutral on Friday. Units fell below their 20 day moving average on Friday. Short term momentum indicators turned down on Friday. Technical score dropped last week to -2 from 6.
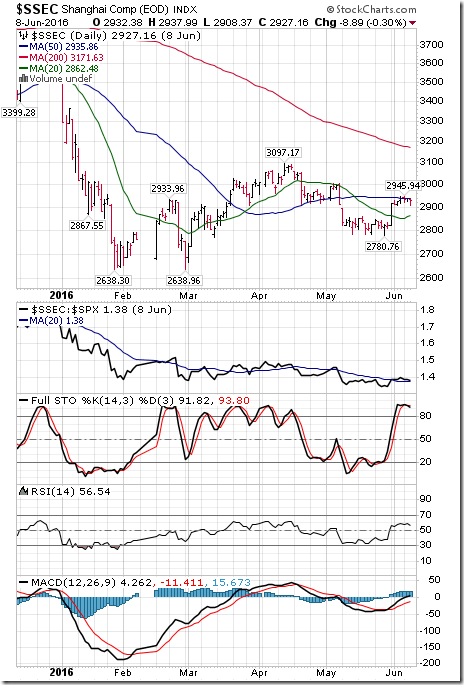
The Shanghai Composite Index dropped 11.52 points (0.39%) last week. Intermediate trend remains up. Strength relative to the S&P 500 Index remains neutral. The Index remains above its 20 day moving average. Short term momentum indicators are trending up. Technical score remained last week at 4.
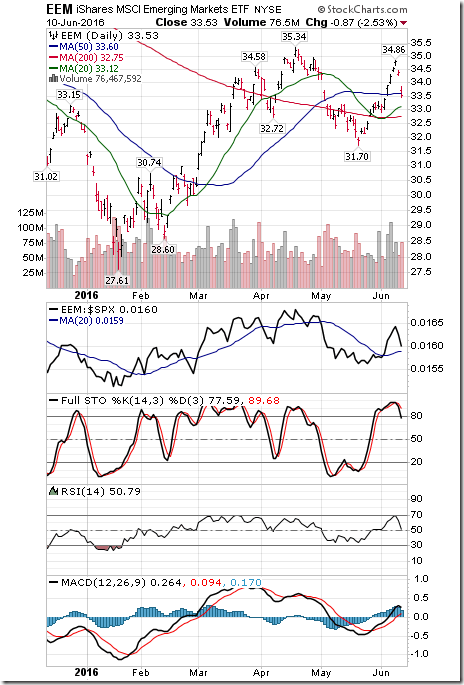
Emerging Markets iShares dropped $0.35 (1.03%) last week. Intermediate trend remains up. Strength relative to the S&P 500 Index remains positive. Units remain above their 20 day moving average. Short term momentum indicators turned down on Friday. Technical score slipped last week to 4 from 6
Currencies
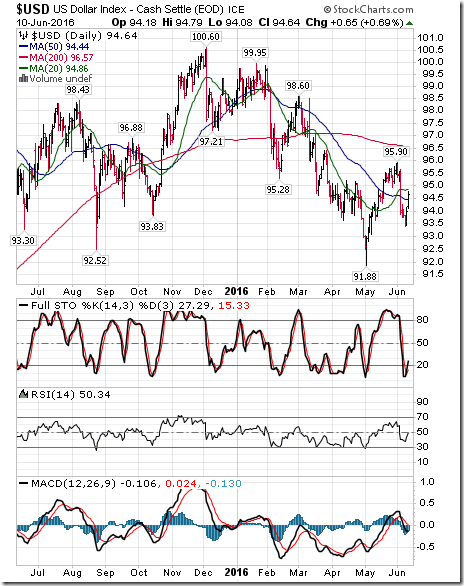
The U.S. Dollar Index added 0.61 (0.65%) last week with all of the gain occurring on Friday. Intermediate trend remains down. The Index remained below its 20 day moving average. Trend for short term momentum indicators changed to up from down on Friday.
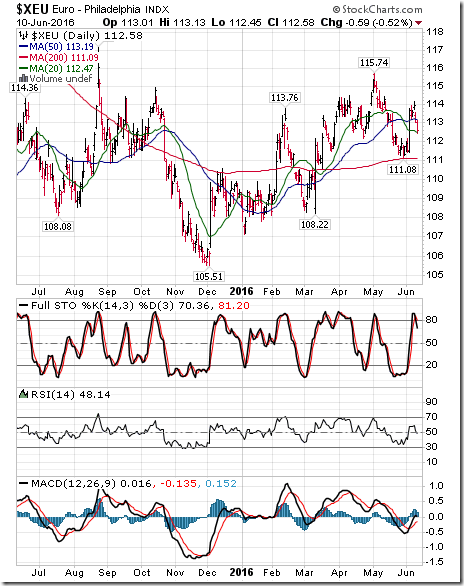
The Euro dropped 1.08 (0.95%) last week with most of the drop occurring on Friday. Intermediate trend remains up. The Euro remained above its 20 day moving average. Short term momentum indicators changed on Friday to down from up.
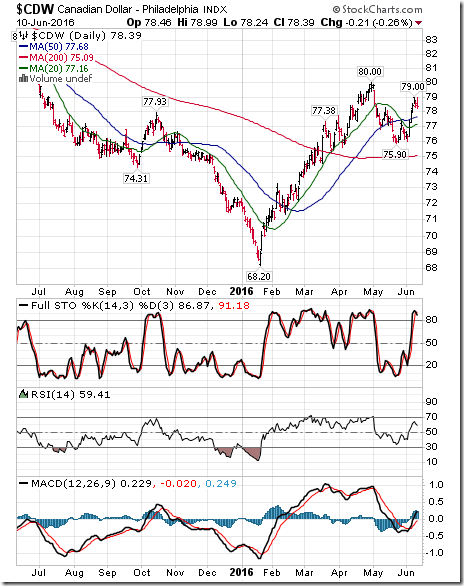
The Canadian Dollar added US 1.10 cents (1.42%) last week. Intermediate trend remains up. The Canuck Buck remained above its 20 day moving average. Short term momentum indicators are trending up.
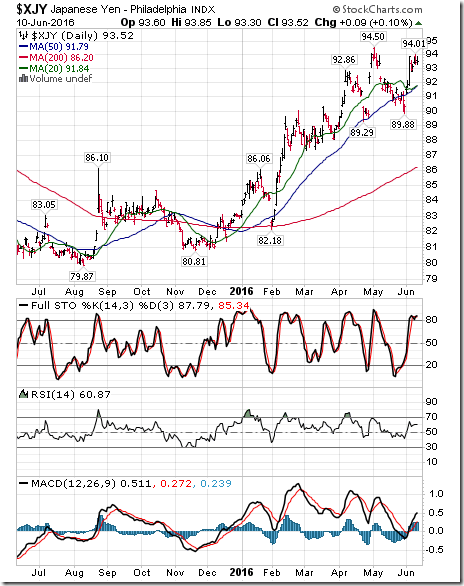
The Japanese Yen slipped 0.34 (0.36%) last week. Intermediate trend remains up. The Yen remains above its 20 day moving average. Short term momentum indicators are trending up.
Commodities
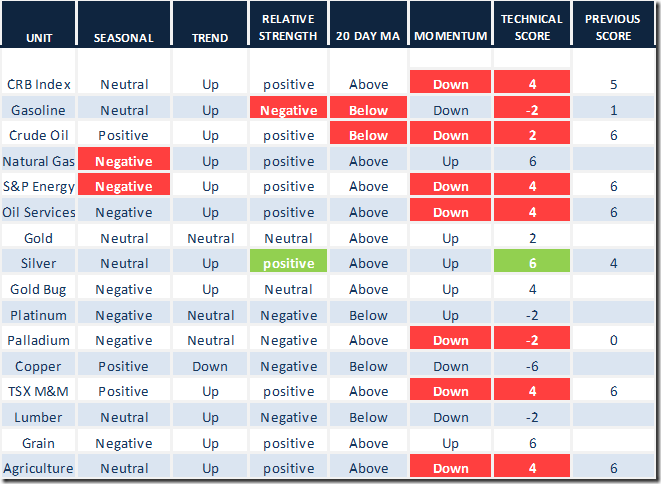
Daily Seasonal/Technical Commodities Trends for June 10th 2016
Green: Increase from previous day
Red: Decrease from previous day
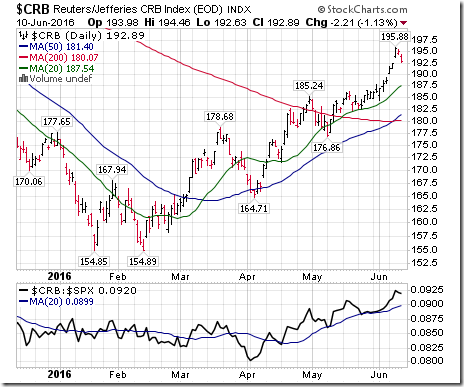
The CRB Index added 14.22 points (2.24%) last week. Intermediate trend remains up. Strength relative to the S&P 500 Index remains positive. The Index remains above its 20 day moving average. Short term momentum indicators turned down on Friday. Technical score slipped last week to 4 from 5.
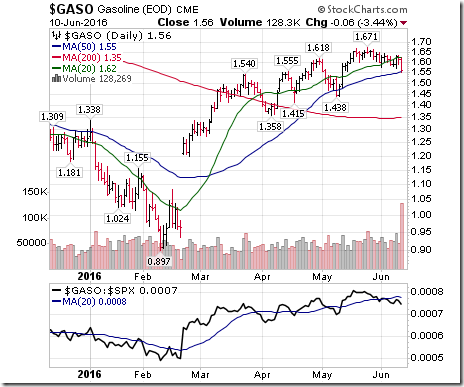
Gasoline dropped $0.05 per gallon (3.11%) last week. Intermediate trend remains up. Strength relative to the S&P 500 Index changed to negative from neutral. Gas dropped below its 20 day moving average. Short term momentum indicators are trending down. Technical score: -2
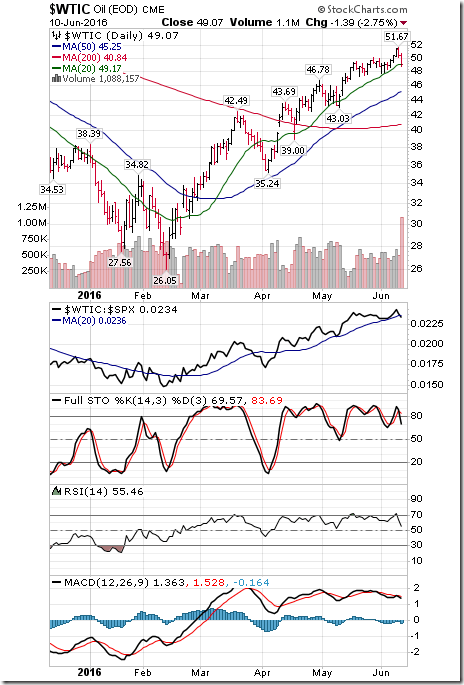
Crude oil added $0.45 per barrel (0.93%) last week. Intermediate trend remains up. Strength relative to the S&P 500 remains positive. Crude fell below its 20 day moving average on Friday. Short term momentum indicators started to trend down on Friday. Technical score dropped on Friday to 2 from 6.
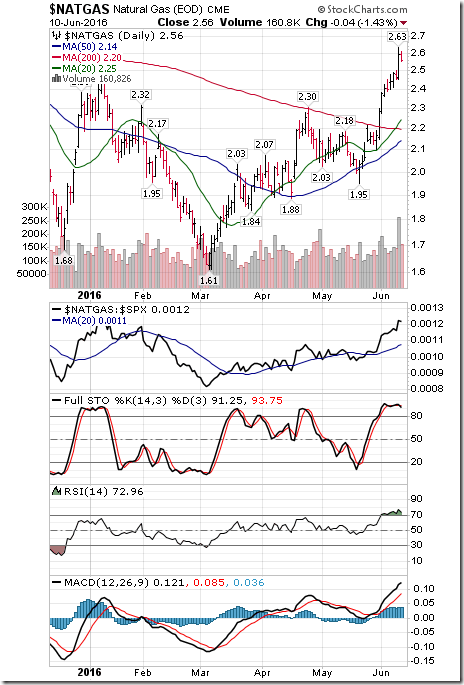
Natural gas gained another $0.16 per MBtu (6.67%) last week. Intermediate trend remains up. Strength relative to the S&P 500 Index remains positive. “Natty” remains above its 20 day moving average. Short term momentum indicators are trending up. Technical score remained last week at 6.
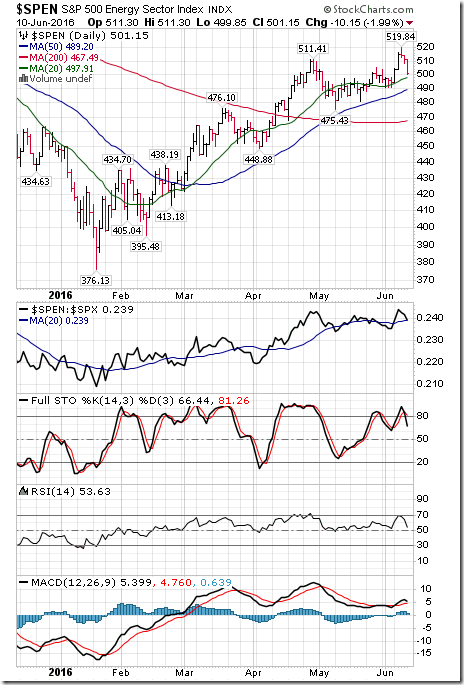
The S&P Energy Index added 6.84 points (1.38%) last week. Intermediate trend remains up. Strength relative to the S&P 500 Index changed to positive from neutral. The Index remains above its 20 day moving average. Short term momentum indicators turned down on Friday. Technical score improved last week to 4 from 2.
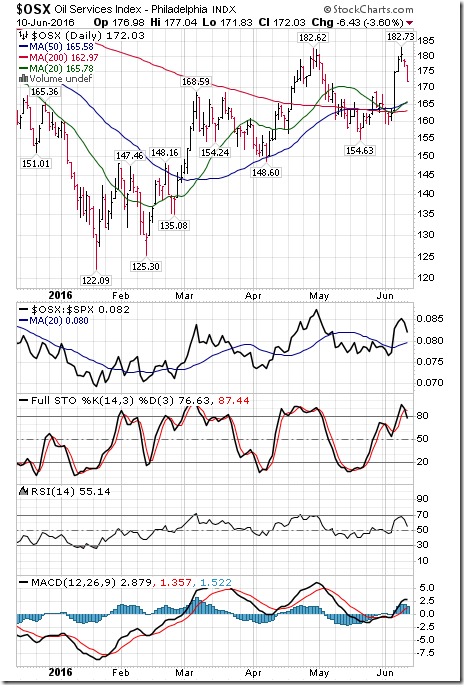
The Philadelphia Oil Services Index gained 9.94 points (6.13%) last week. Intermediate trend remains up. Strength relative to the S&P 500 Index changed to positive from negative. The Index moved above its 20 day moving average. Short term momentum indicators turned down on Friday.
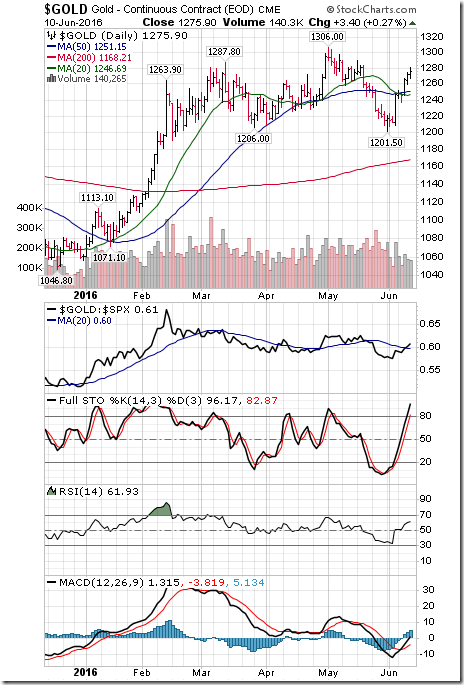
Gold added $33.00 per ounce (2.66%) last week. Intermediate trend remains neutral. Strength relative to the S&P 500 Index changed to neutral from negative. Gold moved above its 20 day moving average. Short term momentum indicators are trending up. Technical score improved last week to 2 from -2.
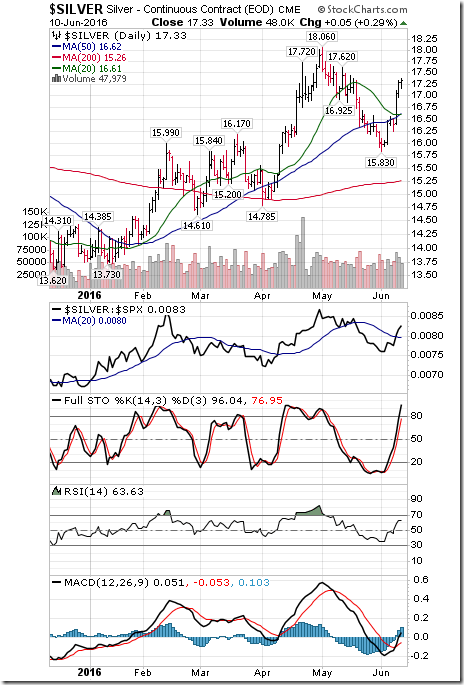
Silver gained $0.97 per ounce (5.93%) last week. Intermediate trend remains up. Strength relative to the S&P 500 Index changed to positive from negative. Silver moved above its 20 day moving average. Short term momentum indicators are trending up. Technical score improved last week to 6 from 0.
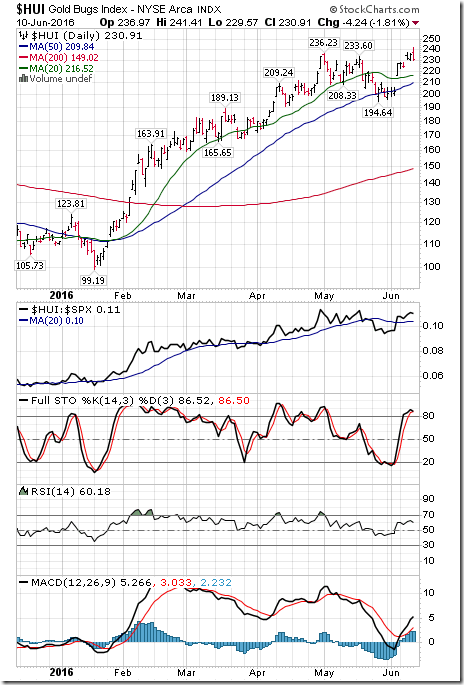
The AMEX Gold Bug Index added 4.30 points (1.90%) last week. Intermediate trend remains up. Strength relative to the S&P 500 Index remained neutral. The Index remains above its 20 day moving average. Short term momentum indicators are trending up. Technical score remained last week at 4.
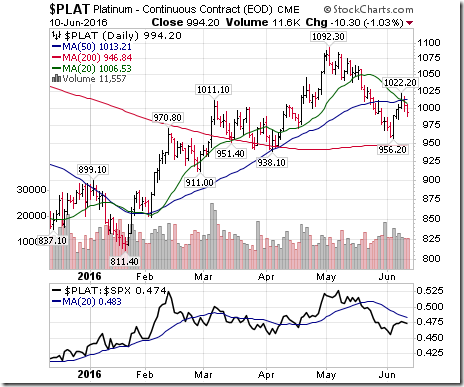
Platinum added $12.30 per ounce (1.25%) last week. Trend remains neutral. Relative strength remains negative. Remains below its 20 day MA. Momentum trending up. Score: -2
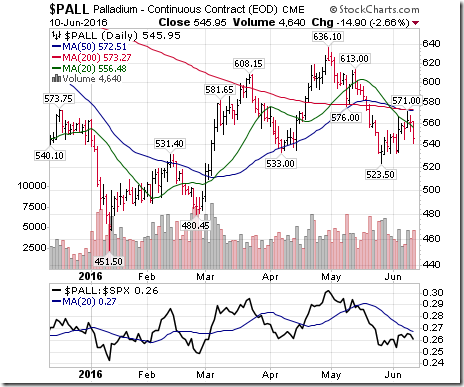
Palladium slipped $3.40 per ounce (0.62%) last week. Intermediate trend remains neutral. Strength relative to the S&P 500 Index remained negative. PALL dropped below its 20 day MA on Friday. Short term momentum indicators are trending up. Score remained at -2
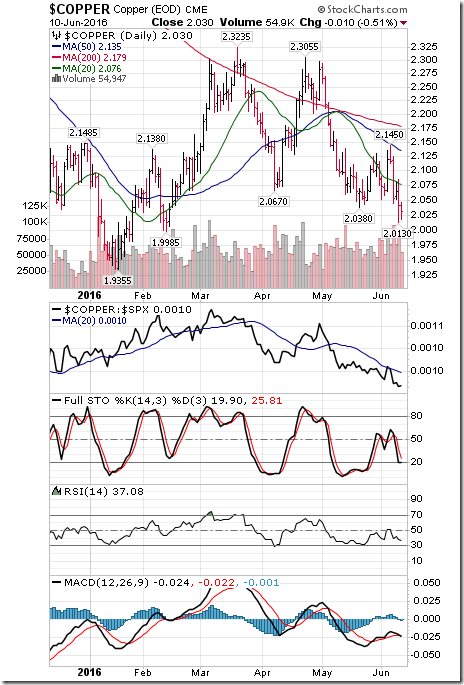
Copper dropped $0.08 per lb (3.93%) last week. Intermediate downtrend was extended on a move below $2.038. Strength relative to the S&P 500 Index changed to negative from neutral. Copper moved below its 20 day moving average. Short term momentum indicators are trending down. Technical score dropped last week to -6 from 0.
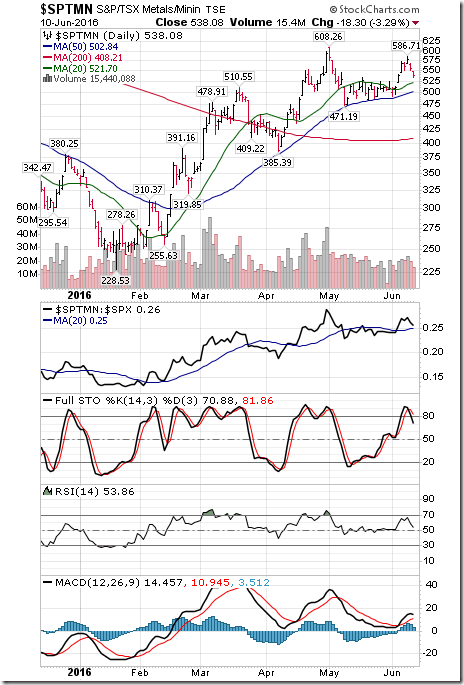
TSX Metals & Mining Index added 0.27 (0.05%) last week. Intermediate trend remains up. Strength relative to the S&P 500 Index remains positive. The Index remains above its 20 day moving average. Short term momentum indicators turned down on Friday. Technical score slipped last week to 4 from 6.
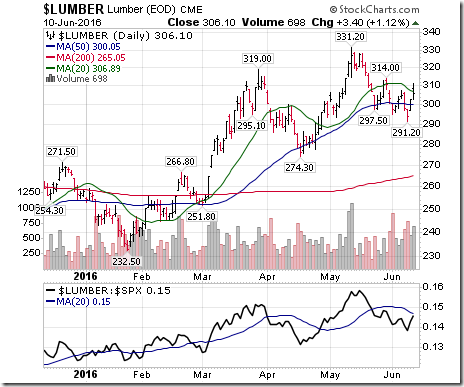
Lumber added 4.30 (1.42%) last week. Trend remains up. Relative strength remains negative. Remains below its 20 day moving average. Momentum indicators trending up.
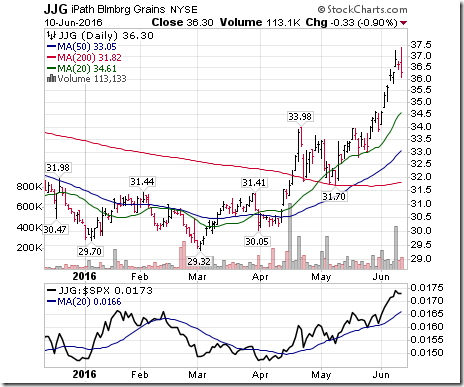
The Grain ETN added $0.67 (1.88%) last week. Intermediate trend remains up. Strength relative to the S&P 500 Index remains positive. Units remain above their 20 day moving average. Short term momentum indicators continue to trend up. Technical score remains at 6
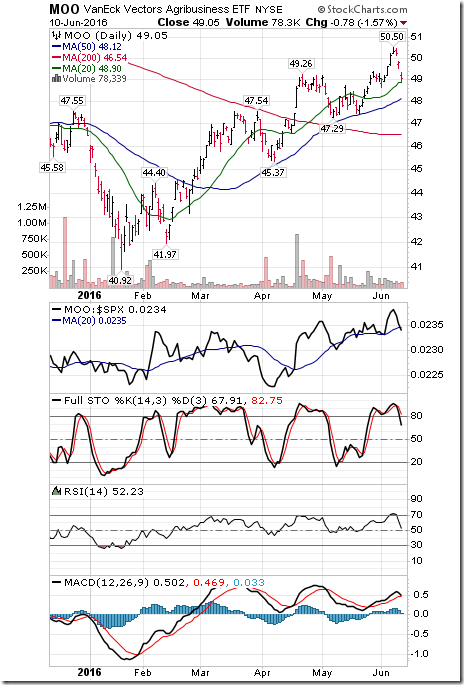
The Agriculture ETF slipped $0.57 (1.15%) last week. Intermediate trend remains up. Strength relative to the S&P500 Index remains positive. Units remain above their 20 day moving average. Short term momentum indicators turned down on Friday. Technical score dipped last week to 4 from 6.
Interest Rates
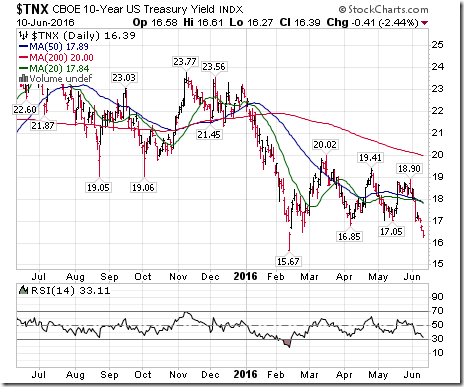
Yield on 10 year Treasuries dropped 6.5 basis points (3.81%) last week to an all-time closing low. Yield remains below its 20 day moving average. Short term momentum indicators are trending down.
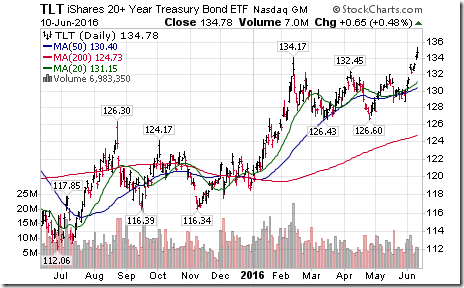
Conversely, price of the long term Treasury ETF gained $1.55 (1.16%) last week. Trend remains up. Units remained above their 20 day moving average.
Volatility
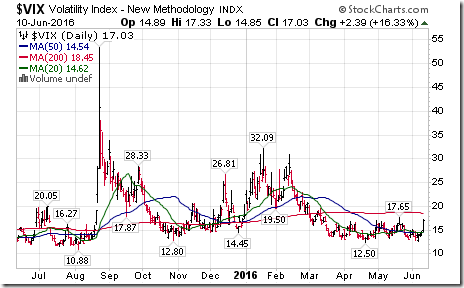
The VIX Index jumped 3.67 (27.47%) last week with most of the gain occurring on Friday. Intermediate trend remains neutral. The Index moved above its 20 day moving average.
Sectors
Daily Seasonal/Technical Sector Trends for March June 10th 2016
Green: Increase from previous day
Red: Decrease from previous day
StockTwits Released on Friday @equityclock
Treasury prices breaking out and yields breaking down as equities remain near all-time highs.
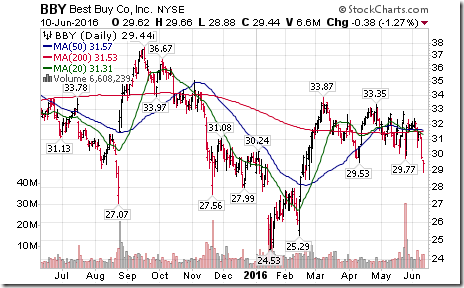
Technical action by S&P 500 stocks to 10:15: Brearish. Breakouts: $AEP, $ED, $SO. Breakdowns: $BBY, $CMG, $EXPE, $PYPL, $VLO, $MS, $PRU, $PSA, $TROW
Editor’s update: After 10:15 AM EDT, K and SO broke resistance and NWSA, KMX, AMG, DISCA and BAC
Breakouts dominated by Cons. Discretionary stocks: $BBY, $CMG, $EXPE, $PYPL
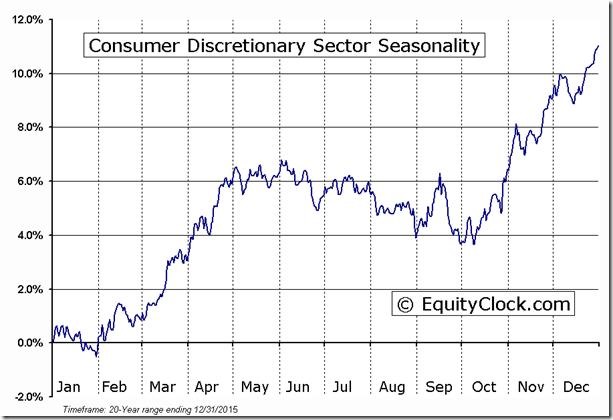
‘Tis the season for weakness in Consumer Discretionary stocks to mid-October.
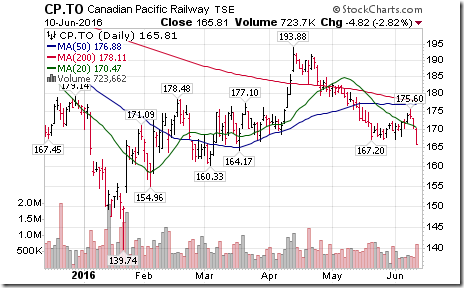
Canadian Pacific $CP.CA broke support at $167.26 to establish intermediate downtrend.
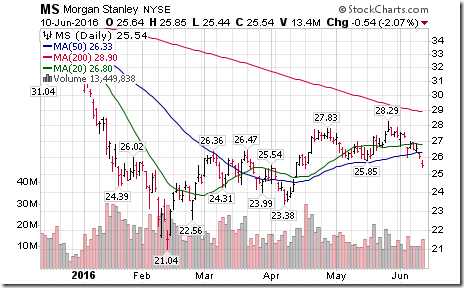
Breakdown by Morgan Stanley $MS below $25.85 attributed to lower Treasury rates.
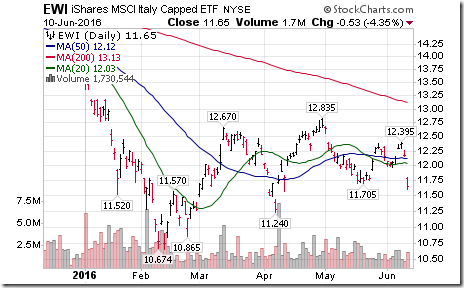
Italy iShares $EWI broke support at $11.70 establishing intermediate downtrend.
U.K. iShares $EWU broke support at $15.60 extending intermediate downtrend. Brexit concerns?
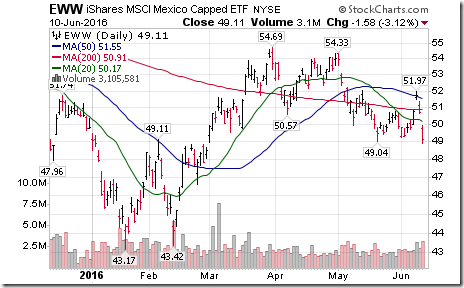
Mexico iShares $EWW broke support at $49.05 extending intermediate downtrend
Mark Leibovit’s Weekly “Wall Street Raw” Radio Show
WALL STREET RAW RADIO WITH MARK LEIBOVIT AND GUESTS SINCLAIR NOE AND RAYMOND MERRIMAN – JUNE 11, 2016
Special Free Services available through www.equityclock.com
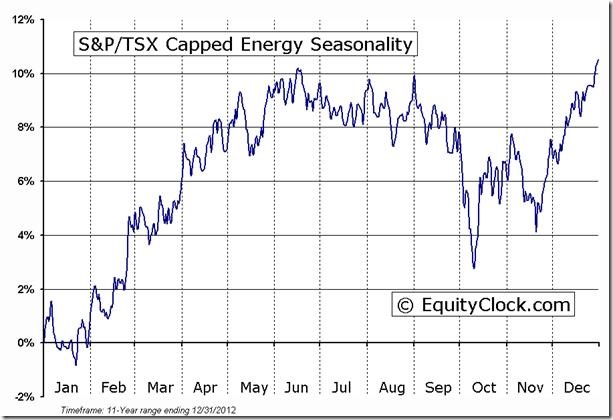
Equityclock.com is offering free access to a data base showing seasonal studies on individual stocks and sectors. The data base holds seasonality studies on over 1000 big and moderate cap securities and indices. To login, simply go to http://www.equityclock.com/charts/ Following is an example:
Accountability Report
The momentum inflection point by North American equity indices/stocks/ETFs on Friday at a time when North American equity markets regular reach a seasonal peak has prompted Tech Talk to no longer hold support a series of previously supported seasonal trading ideas. All showed a roll over by their short term momentum indicators and a drop in their strength relative to the S&P 500 Index to below positive levels on Friday:
XEG.TO ($11.71) originally recommended on BNN on April 12th at $10.92
FBT ($92.77) originally recommended on BNN on April 12th at $91.69 and re-affirmed on BNN on May 17th at $88.25.
FHQ.TO ($21.39) originally recommended on BNN on April 12th at $21.17 and re-affirmed on BNN on May 17th at $20.32.
FTS.TO ($41.86) originally supported in StockTwits at $41.05 on May 12th and recommended on BNN on May 17th at $40.40.
FFIV ($119.41) supported in StockTwits at $106.80 on May 16th
FXL ($33.32) recommend on BNN at $31.06 on May 17th
CRM ($81.83) supported in StockTwits at $77.62 on May 18th
QCOM ($53.83) supported in StockTwits at $53.83 on May 20th
IBB ($267.60) supported in StockTwits at $278.97 on May 31st
Disclaimer: Seasonality and technical ratings offered in this report by www.timingthemarket.ca and www.equityclock.com are for information only. They should not be considered as advice to purchase or to sell mentioned securities. Data offered in this report is believed to be accurate, but is not guaranteed
Copyright © DV Tech Talk, Timingthemarket.ca


![clip_image002[5] clip_image002[5]](https://advisoranalyst.com/wp-content/uploads/2019/08/2bd1999ea023479704e94c43bd66ae63.png)
