


Crude Oil Confirms An Epic Failed Breakdown
From the desk of Thomas Bruni @BruniCharting, via AllStarCharts.com
Crude Oil confirmed a failed breakdown below the 2009 lows last week. This development is extremely important from a risk management standpoint and has big implications from an inter-market perspective.
This market has been in a structural downtrend since late 2014 when prices broke down out of a five year long symmetrical triangle. The resolution out of this pattern was explosive, with prices declining roughly 75% off of the 2014 highs in less than two years. During this decline there has been no reason to be long this market for anything more than a tactical bounce, but with last week’s close above the 2009 lows it is finally feasible for those with a longer-term time horizon to approach this market from the long side.
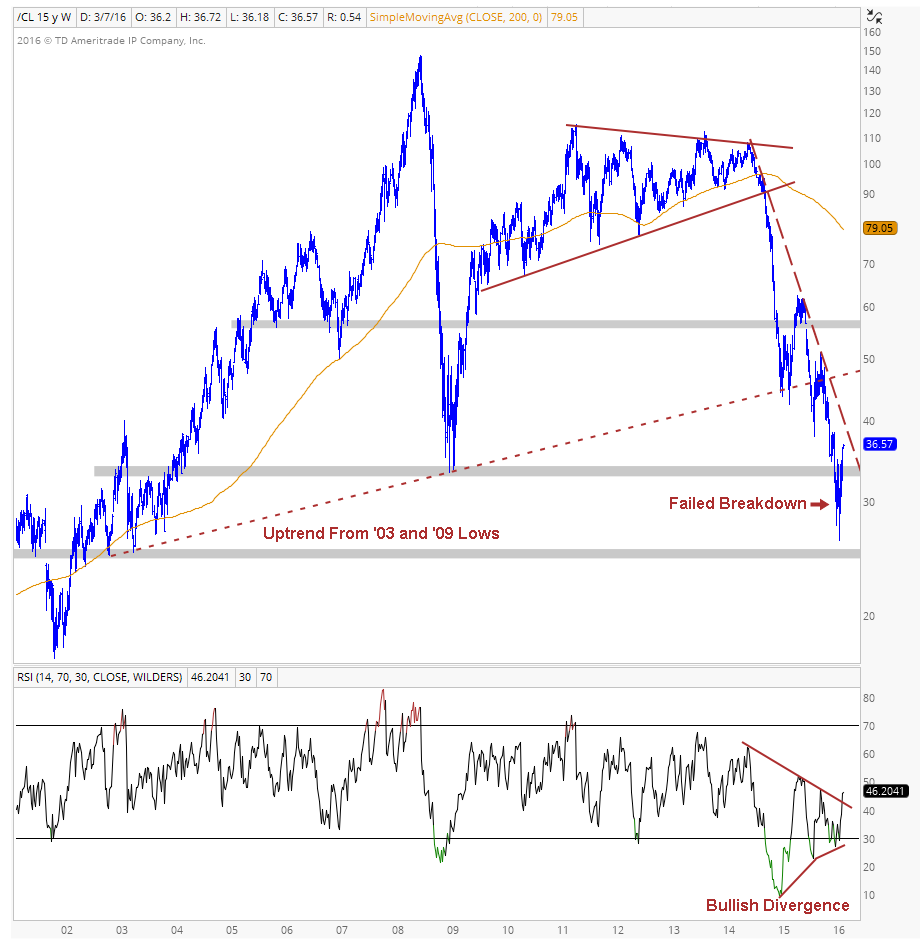
This failed breakdown and bullish divergence could be the start of a longer-term bottom, but more importantly, this development allows us to define our risk. It’s very clear that we only want to be long if Crude continues to close above the 2009 lows on a weekly basis.
The tactical view of Crude Oil over the last nine months suggests that although this market is up over 40% off the February 11th lows, there is still a lot of work to be done before a trend reversal is complete. Prices continue to trade below the downtrend line from the June 2014 highs and a downward sloping 200 day, while momentum remains in a bearish range.

This distinction between structural and tactical time-frames is important because it acknowledges that there are headwinds for this market, but allows those approaching this market from a more structural perspective to express the expectation that the recent improvements in market conditions will continue to build and eventually lead to a long-term bottom, in a way where their risk is well-defined.
This breakout also has significant implications for energy stocks. The four year daily chart of XLE/SPY represents the performance of the energy sector relative to the S&P 500, which recently began to improve.
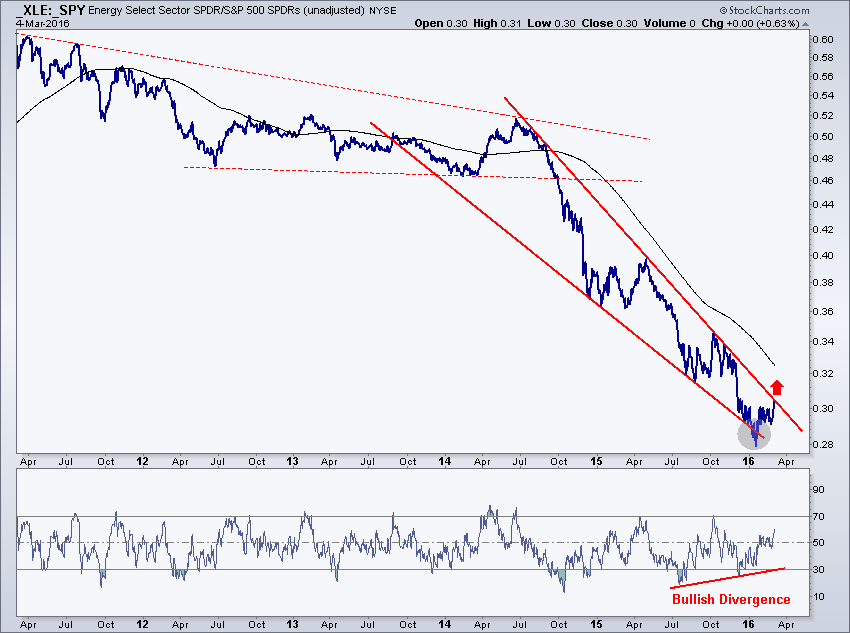
In January this ratio confirmed a failed breakdown below the lower trendline of a multi-year falling wedge which lead to energy out-performing year-to-date. However, this move is part of a much larger pattern which should resolve to the upside if Crude Oil continues to move higher as the weight of evidence suggests. If prices can breakout of this falling wedge, it will likely be the start of a massive move to the upside. Price targets for falling wedge patterns are typically defined by the full-length of the wedge, suggesting that a resolution to the upside could result in a 66% rally in this ratio over the next few years.
The Bottom Line: Nobody knows whether this aggressive rally off the February lows has marked ‘the bottom’ in Crude Oil, but the weekly close above the 2009 lows allows market participants to remain long from a structural perspective as long as we’re above those lows. Additionally, if Crude Oil prices continue to stabilize and move higher then the out-performance in energy stocks relative to the S&P 500 should really start to accelerate.
It should also be noted that similar structural conditions exist in Heating Oil futures, but were not discussed above. The same risk management applies.
As always, if you have any questions feel free to reach out and I’ll get back to you as soon as I can. @BruniCharting
***
JC here – I’m 100% with Bruni on this one. I really like how he explained the difference between the daily tactical outlook and a weekly structural perspective. These are two different viewpoints and really stresses how important it is to define your time horizon. Members of Allstarcharts know we’ve wanted to be long Crude Oil since mid-February and our short-term upside target was $38, which we are approaching now. But longer-term, Bruni is 100% right. The line in the sand is the 2009 lows. Bigger picture, we would only want to be long if we’re above that.
Also, this Wednesday 3/9/16 is our Monthly Members Only Conference Call. If you’ve been considering a 30-Day Risk-Free Trial, now is the time. We are offering a deep discount that only lasts until this Wednesday.
Click here to start your 30-Day Risk-Free Trial Today!
***
Tags: $CL_F $USO $XLE $SPY $OIH $XOP $HO_F
The author does not have a position in the mentioned securities at the time of publication.
For the full disclaimer, click here.
Copyright © AllStarCharts.com