SIA Weekly: Fed's 'Loosest Tightening' in History Means Continued Uncertainty and Volatility
For the first time in nearly a decade, the US Federal Reserve yesterday announced it was raising its key policy rate.
In direct response, North American equity markets gained as the follow-up commentary assured investors that the US economy is resilient enough to withstand additional rate hikes at a gradual pace. Described by Mohamed El-Erian, chief economic advisor at Allianz: "Wrapped in dovish language, the Federal Reserve has just embarked on what will be the loosest tightening in its history; the Fed is going out of its way to assure markets that, by embarking on a 'gradual' path, this will not be your traditional interest rate cycle. Instead it will be one remembered as an unusually loose tightening."
This 'gradual' tightening differs very much so compared to what many of us had witnessed in the past with the likes of Alan Greenspan for example. With this approach, we can be certain of continued uncertainty and therefore volatility in the currency, equities, and fixed income markets for the months and years to come.
For this week's SIA Equity Leaders Weekly, it only seems appropriate to have an updated look at the USDCAD relationship and the CBOE 30 Yr Interest Rate charts, both of which will 'gradually' respond to further Fed policy announcements.
United States Dollar/Canadian Dollar (USDCAD)
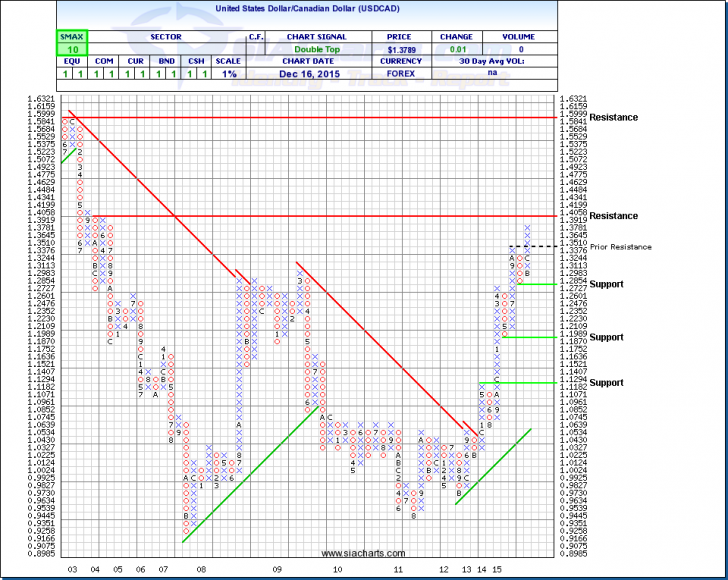
Back about a month ago, we commented on the USDCAD running up and topping-out at $1.3510 in early October before developing a 4-box reversal of O's which took place in October. Since then the USD rallied through the $1.35 resistance level and is now focussed on entering the $1.40 waters. The anticipation of the actions of the Federal Reserve helped push this up further adding another new X to the chart and taking the Canadian loonie to levels not seen in over a decade.
Going forward into 2016, the central banks on either side of the border will have the most influence on direction based on respective interest rate policy.
Click on Image to Enlarge
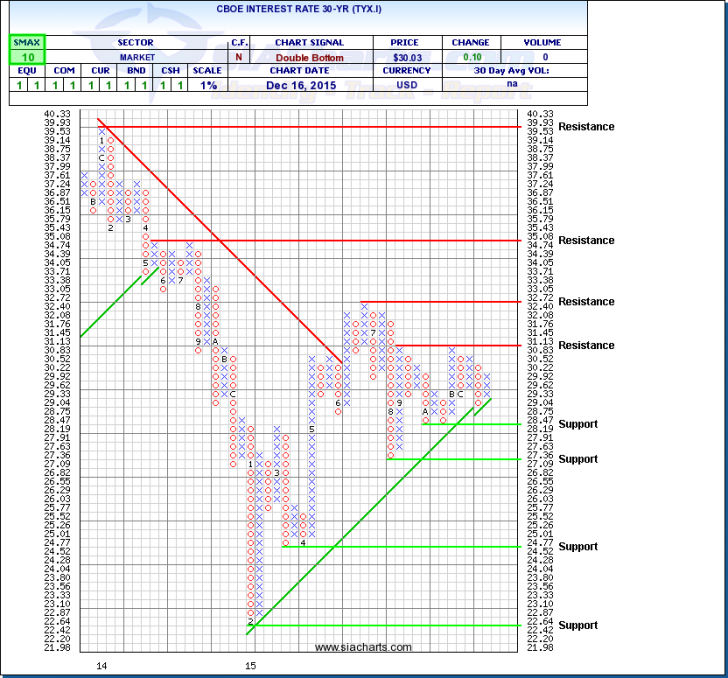
CBOE Interest Rate 30 - YR (TYX.I)
When we last looked at the TYX.I back in late September, we discussed the substantial bounce off the 2.242% level and then all the way up to resistance at 3.272%. But since then, we have been range bound between the 2.709 support and that 3.113 resistance.
Much of that tug-a-war had to do with the continued debate on the strength of the economy, inflation outlook, and the never ending discussion on possible interest rate hikes by the Federal Reserve in the US. And even with the small increase made today, as well as the comments on further increases the market here remains in a tight consolidation pattern; the wait and see game continues.
Both of these charts continue to give us relevant information that we need to monitor in order to make important decisions for our clients. Further updates can be anticipated.
Click on Image to Enlarge
SIACharts.com specifically represents that it does not give investment advice or advocate the purchase or sale of any security or investment. None of the information contained in this website or document constitutes an offer to sell or the solicitation of an offer to buy any security or other investment or an offer to provide investment services of any kind. Neither SIACharts.com (FundCharts Inc.) nor its third party content providers shall be liable for any errors, inaccuracies or delays in content, or for any actions taken in reliance thereon.
For a more in-depth analysis on the relative strength of the equity markets, bonds, commodities, currencies, etc. or for more information on SIACharts.com, you can contact our customer support at 1-877-668-1332 or siateam@siacharts.com.


