Vialoux's Technical Talk – September 28, 2015
by Don Vialoux, EquityClock.com
Pre-opening Comments for Monday September 28th
U.S. equity index futures were lower this morning. S&P 500 futures were down 13 points in pre-opening trade.
Index futures were virtually unchanged following release of economic news at 8:30 AM EDT. Consensus for August Personal Income was an increase of 0.4% versus a gain of 0.4% in July. Actual was an increase of 0.3%. Consensus for August Personal Spending was a gain of 0.3% versus an increase of 0.3% in July. Actual was a gain of 0.4%.
Alcoa gained $0.48 to $9.55 after announcing plans to split into two publicly traded companies
Citigroup slipped $0.05 to $50.50 despite an upgrade by Credit Suisse to Outperform. Target price is $62.
TD Ameritrade (AMTD $32.44) is expected to open lower after Wells Fargo downgraded the stock to Market Perform.
British Petroleum slipped $0.55 to$29.88 despite BMO Capital initiating coverage with an Outperform rating.
Eli Lilly added $0.04 to $84.10 after the company announce Phase II success on a cancer drug.
EquityClock’s Daily Market Comment
Following is a link:
http://www.equityclock.com/2015/09/25/stock-market-outlook-for-september-28-2015/
Note seasonality charts on New Home Sales
Mark Leibovit’s Comment on Palladium
Following is a link:
http://leibovitvrnewsletters.com/wp-content/uploads/2015/09/VR-Gold-Letter-150925.pdf
Economic News This Week
August Personal Income to be released at 8:30 AM EDT on Monday is expected to increase 0.4% versus a gain of 0.4% in July. August Personal Spending is expected to grow 0.3% versus a gain of 0.3% in July.
July Case/Shiller 20 City year-over-year home price index to be released at 9:00 AM EDT on Tuesday is expected to improve to 5.1% from 5.0% in June.
September Consumer Confidence to be released at 10:00 AM EDT on Tuesday is expected to slip to 96.0 from 101.5 in August.
September ADP Employment Report to be released at 8:15 AM EDT on Wednesday is expected to show a decrease to 188,000 from 190,000 in August
Canadian July GDP to be released at 8:30 AM EDT on Wednesday is expected to increase 0.2% versus a gain of 0.5% in June.
September Chicago PMI to be released at 9:45 AM EDT on Wednesday is expected to slip to 53.1 from 54.4 in August
Weekly Jobless Claims to be released at 8:30 AM EDT on Thursday are expected to increase to 270,000 from 267,000 last week
September ISM to be released at 10:00 AM EDT on Thursday is expected to slip to 50.6 from 51.1 in August.
August Construction Spending to be released at 10:00 AM EDT on Thursday are expected to increase 0.6% versus a gain of 0.7% in July.
September Non-farm Payrolls to be released at 8:30 AM EDT on Friday are expected to increase to 200,000 from 173,000 in August. Private Non-farm Payrolls are expected to increase to 196,000 from 140,000 in August. September Unemployment Rate is expected to remain unchanged from August at 5.1%. September Hourly Earnings are expected to increase 0.2% versus a gain of 0.3% in August.
August Factory Orders to be released at 10:00 AM EDT on Friday are expected to drop 1.0% versus a gain of 0.4% in July.
Earnings News This Week
Tuesday: Costco
Thursday: Micron
The Botttom Line
Buy on weakness during the next two weeks. Most equity markets and economic sensitive sectors and commodities reached an intermediate low on or about August 25th. However, the weakest three week period in the year for North American equity markets between the last week in September and the second week in October is happening once again. Volatility remains elevated. Recent news by the Federal Reserve and Janet Yellen has not helped. Equity markets around the world appear to be forming a base building pattern that likely will continue to develop well into October until resumption of the traditional late October to early May period of seasonal strength resumes. Weakness in equity markets during the next two weeks is an opportunity to accumulate favoured equities, economic sensitive sectors and commodities when they begin to show technical signs of bottoming.
Equities
Editor’s Note: Seasonal influences for many equity indices, commodities and sectors change at this time from negative to neutral. They subsequently change positive in the second half of October.
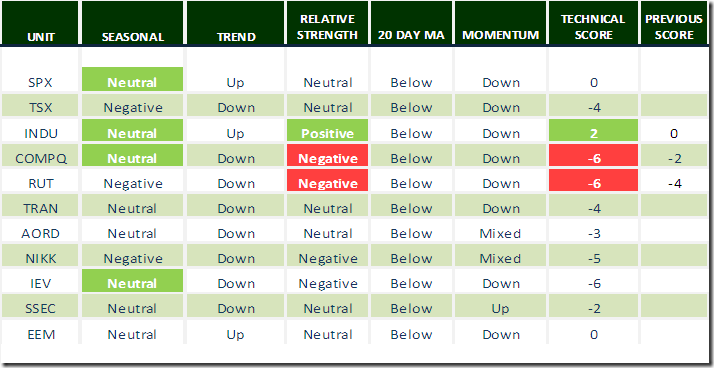
Daily Seasonal/Technical Equity Trends for September 25th 2015
Green: Increase from previous day
Red: Decrease from previous day
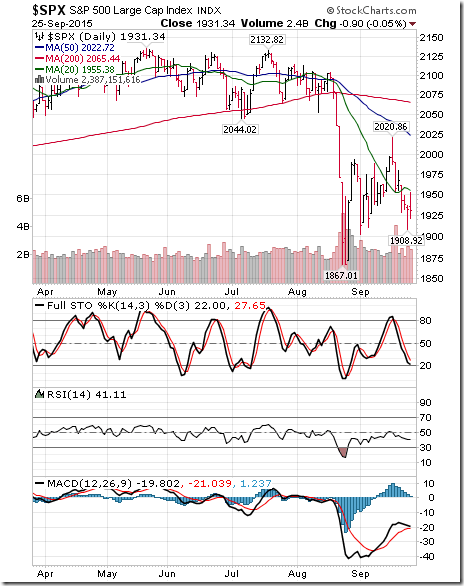
The S&P 500 Index gave up 26.73 points (1.37%) last week. Intermediate trend remains up. The Index fell below its 20 day moving average last week. Short term momentum indicators are trending down
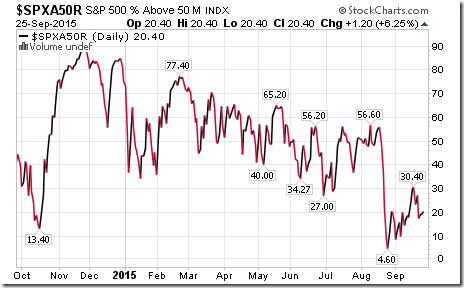
Percent of S&P 500 stocks trading above their 50 day moving average slipped last week to 20.40% from 23.40%. Percent reached an intermediate bottom on August 25th.
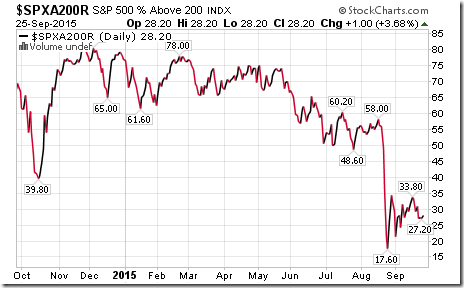
Percent of S&P 500 stocks trading above their 200 day moving average eased last week to 28.20% from 29.20%. Percent reached an intermediate bottom on August 25th
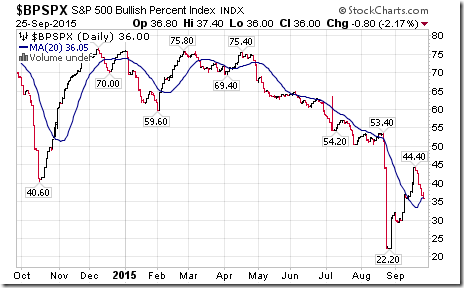
Bullish Percent Index for S&P 500 stocks dropped last week to 36.00% from 43.40% and slipped below its 20 day moving average. The Index reached an intermediate bottom on August 25th
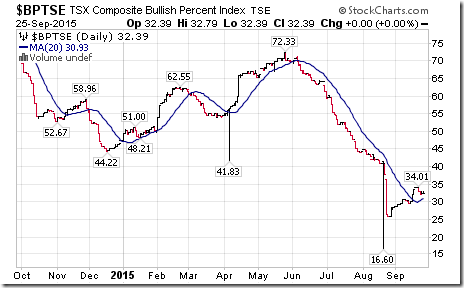
Bullish Percent Index for TSX Composite stocks slipped last week to 32.39% from 34.01%, but remained above its 20 day moving average. The Index reached an intermediate bottom on August 25th
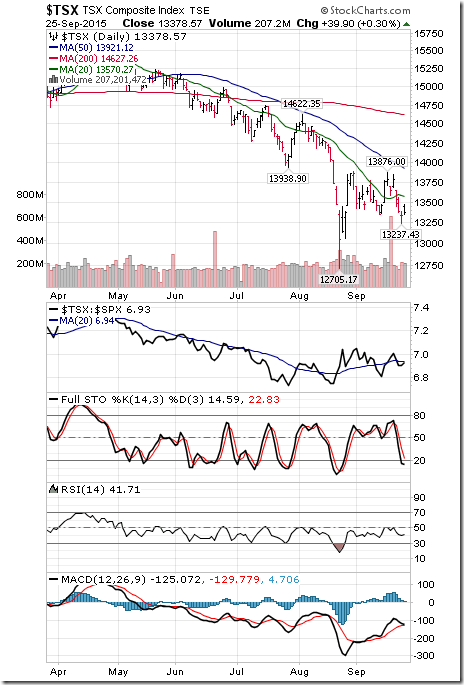
The TSX Composite Index fell 268.33 points (1.97%) last week. Intermediate trend remains down (Score: -2). Strength relative to the S&P 500 Index remains neutral (Score: 0). The Index moved below its 20 day moving average last week (Score: -1). Short term momentum indicators are trending down (Score: -1). Technical score last week dropped to -4 from 0
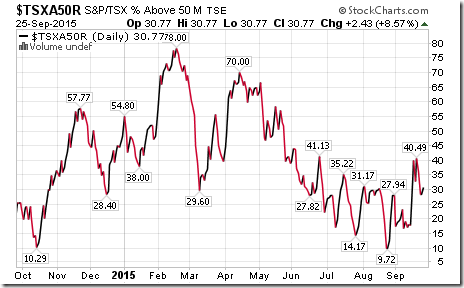
Percent of TSX stocks trading above their 50 day moving average fell to 30.77% from 32.79% last week. Percent reached an intermediate bottom on August 25th
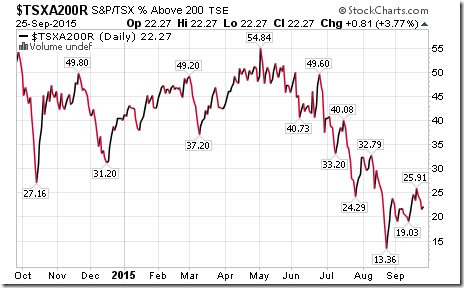
Percent of TSX stocks trading above their 200 day moving average dropped to 22.27% from 23.48% last week. Percent reached an intermediate bottom on August 25th
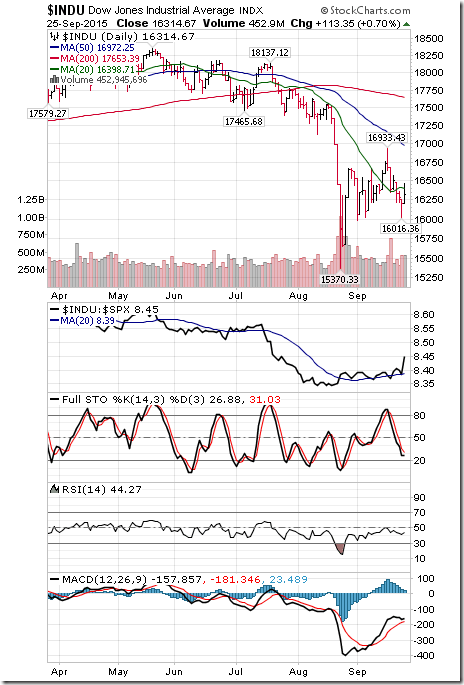
The Dow Jones Industrial Average slipped 70.38 points (0.43%) last week. Intermediate trend remains up. Strength relative to the S&P 500 Index turned positive on Friday. The Average moved below its 20 day moving average last week. Short term momentum indicators are trending down. Technical score slipped to 2 from 3 last week.
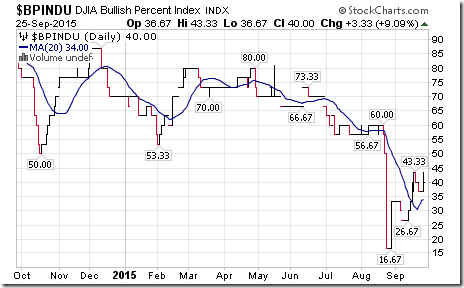
Bullish Percent Index for Dow Jones Industrial Average stocks was unchanged last week at 40.00% and remained above its 20 day moving average. The Index continues to recover from an intermediate low set on August 25th
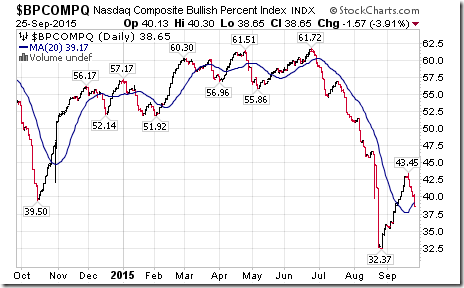
Bullish Percent Index for NASDAQ Composite stocks dropped last week to 38.65% from 42.93% and slipped below its 20 day moving average. The Index continues to recover from a low set on August 25th
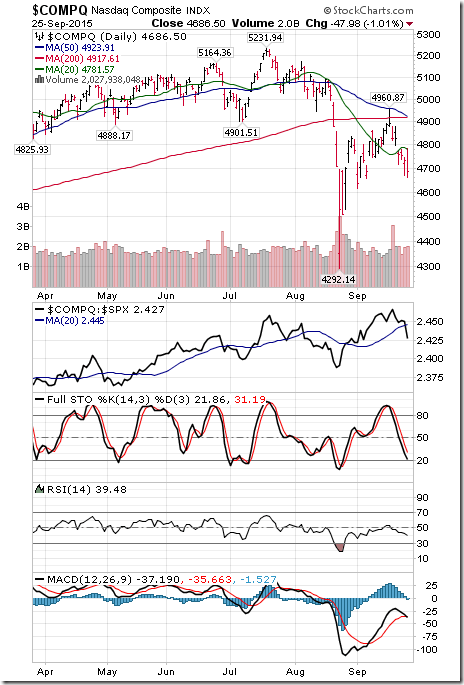
The NASDAQ Composite Index dropped 140.73 points (2.92%) last week. Intermediate trend remains down. Strength relative to the S&P 500 Index turned negative on Friday. The Index fell below its 20 day moving average. Short term momentum indicators are trending down. Technical score dropped to -6 from 3.
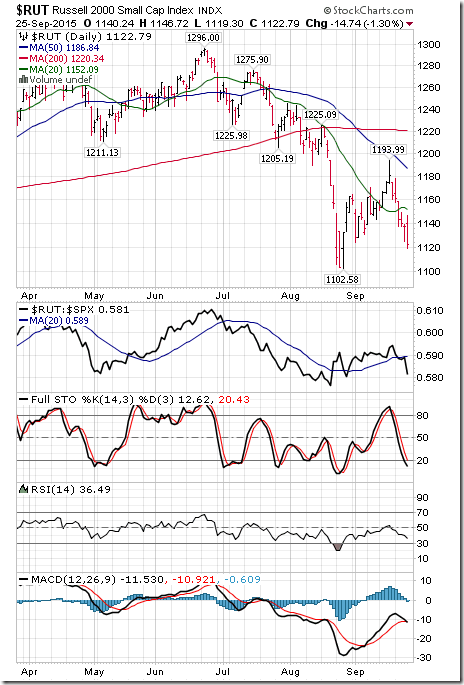
The Russell 2000 Index dropped 40.65 points (3.49%) last week. Intermediate trend remains down. Strength relative to the S&P 500 Index turned negative on Friday. The Index fell below its 20 day moving average last week. Short term momentum indicators are trending down.
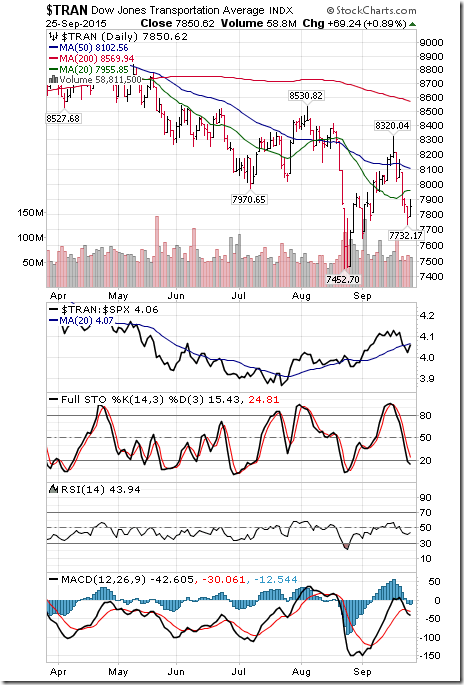
The Dow Jones Transportation Average dropped 185.63 points (2.32%) last week. Intermediate trend remains down. Strength relative to the S&P 500 Index changed to neutral from positive. The Average fell below its 20 day moving average last week. Short term momentum indicators are trending down. Technical score last week dropped to -4 from -1.
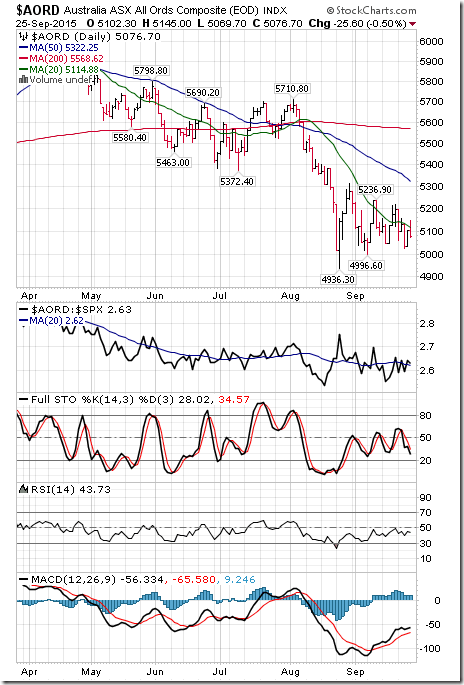
The Australia All Ordinaries Composite Index fell 117.60 points (2.26%) last week. Intermediate trend remains down. Strength relative to the S&P 500 Index remains neutral. The Index fell below its 20 day moving average. Short term momentum indicators are mixed. Technical score slipped last week to -3 from 0.
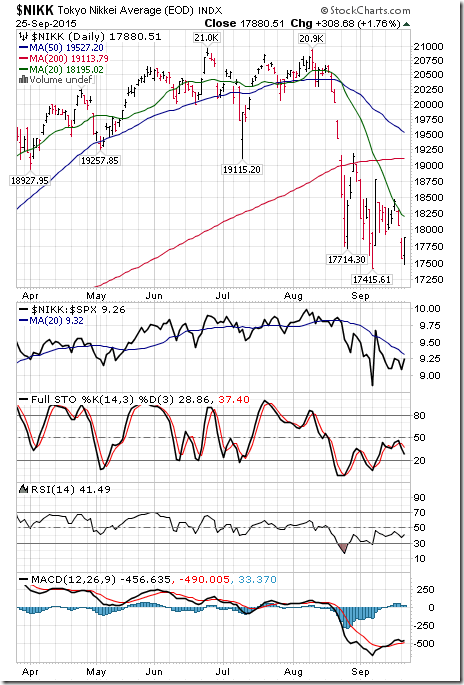
The Nikkei Average dropped 189.70 points (1.05%) last week. Intermediate trend remains down. Strength relative to the S&P 500 Index remains energy. The Average remains below its 20 day moving average. Short term momentum indicators are trending mixed. Technical score slipped to -5 from -4/
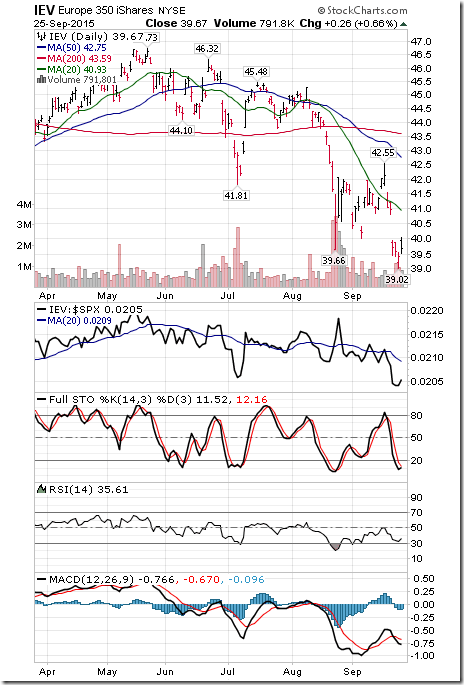
Europe iShares dropped $1.38 (3.36%) last week. Intermediate trend changed to down from up on a move below $39.66. Strength relative to the S&P 500 Index changed last week to negative. Units remain below their 20 day moving average. Short term momentum indicators are trending down. Technical score last week dropped to -6 from 1.
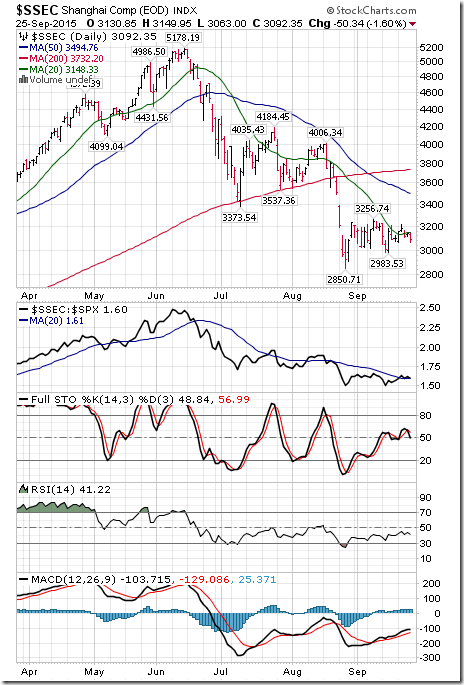
The Shanghai Composite Index slipped 5.57 points (0.18%) last week. Intermediate trend remains down. Strength relative to the S&P 500 Index improved last week to neutral from negative. The Index remains below its 20 day moving average. Short term momentum indicators are trending up. Technical score improved to -2 from -5.
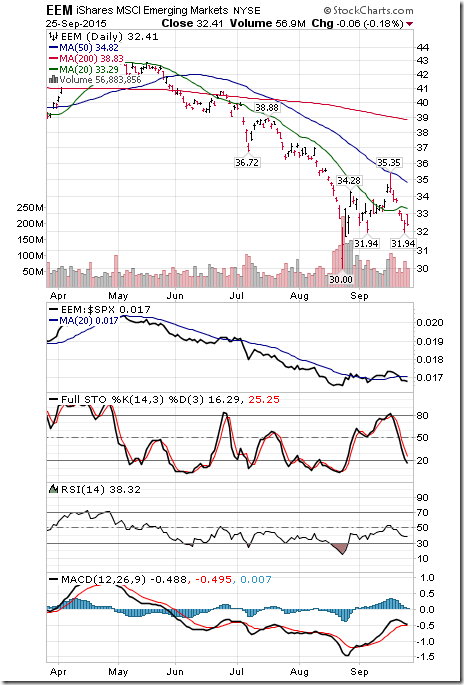
Emerging Markets iShares fell $1.42 (4.20%) last week. Intermediate trend remains up. Strength relative to the S&P 500 Index changed to neutral from positive last week. Units fell below their 20 day moving average. Short term momentum indicators are trending down. Technical score fell last week to 0 form 5.
Currencies
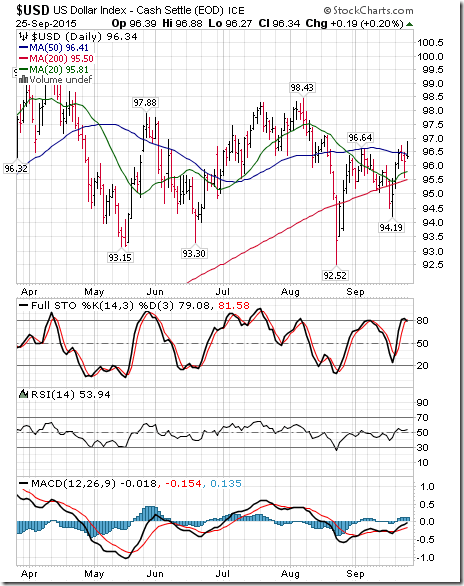
The U.S. Dollar Index gained US 0.98 cents (1.03%) last week. Intermediate trend changed to up from down on a move above 96.64. The Index moved above its 20 day moving average last week. Short term momentum indicators are trending up.
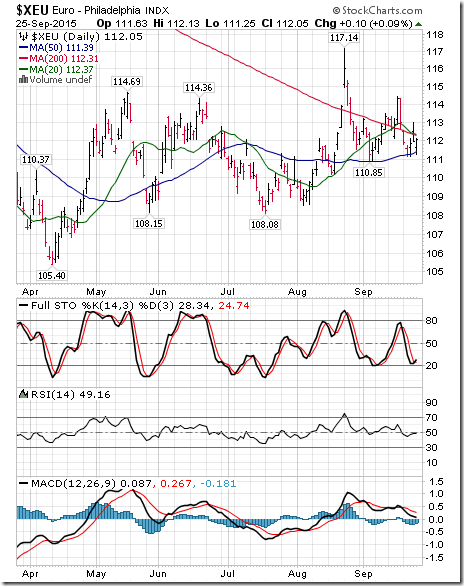
The Euro fell 0.90 (0.80%) last week. Intermediate trend remains up. The Euro fell below its 20 day moving average. Short term momentum indicators are trending down.
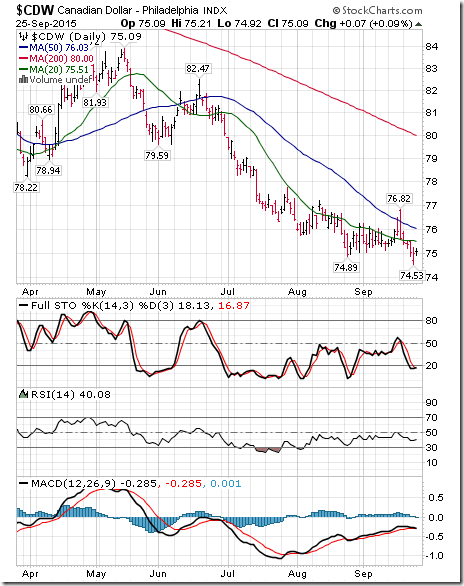
The Canadian Dollar fell US 0.56 cents (0.74%) last week. Intermediate trend changed to down on a move below 74.89 cents to an 11 year low. The Canuck Buck fell below its 20 day moving average. Short term momentum indicators are trending down.
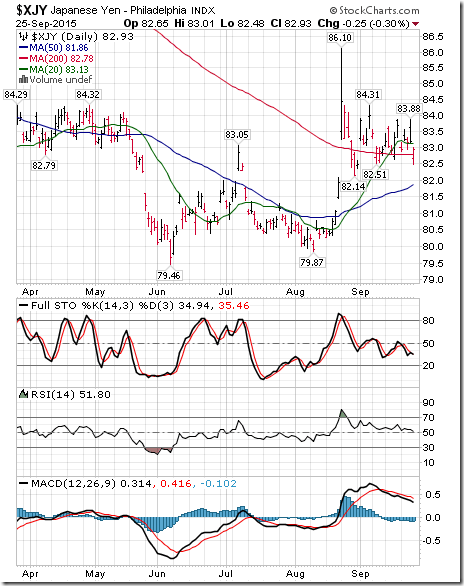
The Japanese Yen fell 0.43 (0.52%) last week. Intermediate trend remains up. The yen fell below its 20 day moving average. Short term momentum indicators are mixed.
Commodities
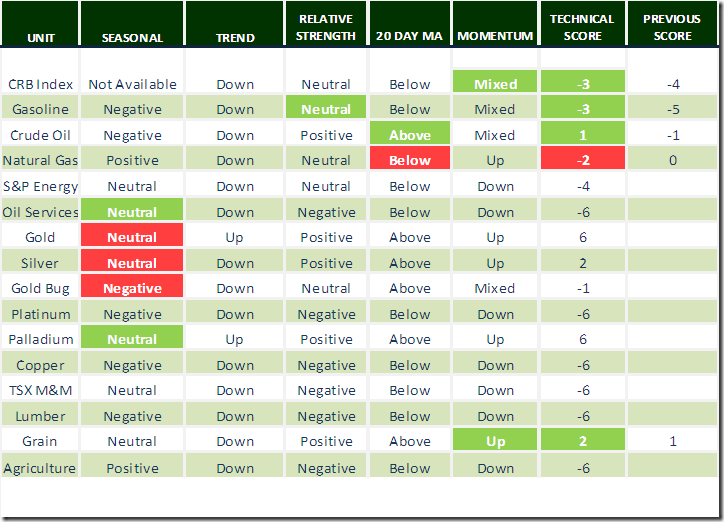
Daily Seasonal/Technical Commodities Trends for September 25th 2015
Green: Increase from previous day
Red: Decrease from previous day
The CRB Index added 1.53 points (0.79%) last week. Intermediate trend remains down. Strength relative to the S&P 500 Index remained neutral last week. The Index remained below its 20 day moving average. Short term momentum indicators are mixed. Technical score remained at -3
Gasoline added $0.02 per gallon (1.47%) last week. Intermediate trend remains down. Strength relative to the S&P 500 Index changed to neutral from negative. Gas remains below its 20 day moving average. Short term momentum indicators are mixed.
Crude Oil added $0.68 per barrel (1.51%) last week. Intermediate trend remains down. Strength relative to the S&P 500 Index remains positive. Crude moved above its 20 day moving average on Friday. Short term momentum indicators are mixed. Technical score remained at 1.
Natural Gas added 0.02 per MBtu (0.77%) last week. Intermediate trend remains down. Strength relative to the S&P 500 Index improved last week to neutral from negative. “Natty” remained below its 20 day moving average. Short term momentum indicators are trending up. Technical score improved to -2 from -6
The S&P Energy Index dropped 5.50 points (1.19%) last week. Intermediate trend remains down. Strength relative to the S&P 500 Index remains neutral. The Index remains below its 20 day moving average. Short term momentum indicators are trending down. Technical score last week dipped to -4 from -3
The Philadelphia Oil Services Index lost 5.29 points (3.12%) last week. Intermediate trend remains down. Strength relative to the S&P 500 Index changed to negative from neutral. The Index remains below its 20 day moving average. Short term momentum indicators are trending down. Technical score dropped to -6 from -4.
Gold added $7.80 per ounce (0.69%) last week. Intermediate trend remains up. Strength relative to the S&P 500 Index changed to positive from negative last week. Gold remains above its 20 day moving average. Short term momentum indicators are trending up. Technical score improved last week to 6 from 4.
Silver slipped $0.05 per ounce (0.33%) last week. Intermediate trend remains down. Strength relative to the S&P 500 Index remains positive. Silver remains above its 20 day moving average. Short term momentum indicators are trending up. Technical score remained at 2. Strength relative to Gold is neutral.
The AMEX Gold Bug Index dropped 5.14 points (4.41%) last week. Intermediate trend remains down. Strength relative to the S&P 500 Index remains neutral. The Index remains above its 20 day moving average. Short term momentum indicators are mixed. Technical score slipped to -1 from 0.
Platinum dropped another $33.30 per ounce (3.38%) last week. Intermediate trend changed to down from neutral on a move below $945.40. Strength relative to S&P 500 remains negative.
Palladium added $56.63 per ounce (9.29%) last week. Trend remains up. Strength relative to the S&P 500 and Gold remains positive. PALL remains above its 20 day moving average. Short term momentum indicators are trending up. Technical score remains at 6.
Copper fell $0.11 per lb. (4.60%) last week. Intermediate trend remains down. Strength relative to the S&P 500 Index changed to negative from positive. Copper fell below its 20 day moving average. Short term momentum indicators are trending down. Technical score dropped to -6 from 1.
The TSX Metals & Mining Index dropped 59.63 points (13.70%) last week. Intermediate downtrend was confirmed on a move below 393.29. Strength relative to the S&P 500 Index changed to negative from neutral. The Index remains below its 20 day moving average. Short term momentum indicators are trending down. Technical score dropped to -6 from -3.
Lumber fell another $15.20 (6.56%) last week. Intermediate trend remains down. Strength relative to the S&P 500 Index changed to negative from neutral. Momentum: down.
The Grain ETN gained $1.10 (3.43%) last week. Trend remains down. Relative strength turned to positive from neutral. Units moved above their 20 day moving average. Short term momentum indicators are trending up. Technical score improved to 2 from -4
The Agriculture ETF plunged $2.36 (4.86%) last week. Intermediate downtrend was confirmed on a move below $47.00. Strength relative to the S&P 500 Index remains negative. Units remain below their 20 day moving average. Short term momentum indicators are trending down. Technical score dipped last week to -6 from -5.
Interest Rates
Yield on 10 year Treasuries increased 3.8 basis points (1.78%) last week. Yield fell below its 20 day moving average. Short term momentum indicators are mixed.
Price of the long term Treasury ETF slipped $0.56 (0.44%) last week. Trend remains up. Units remain above their 20 day moving average.
Other Issues
The VIX Index added 0.38 (1.67%) last week. The Index remains elevated.
Earnings news is quiet this week. Costco’s report on Tuesday is a focus.
Short term technical indicators for most equity markets and sectors are trending down and areoversold, but have yet to show signs of bottoming
Technical action by individual S&P 500 stocks was decidedly bearish last week. Five stocks broke resistance and 67 stocks broke support.
Intermediate technical indicators continue to show an intermediate bottom for North American equity markets and most sectors on August 25th, typical of a market that has corrected during a volatility spike and is developing a base building pattern.
Economic focus this week is on the August employment report on Friday. The report is expected to be mildly encouraging relative to a less than consensus July report. Other U.S. economic reports are expected to show continuing growth, but at a decelerating rate.
Weakest three week period in the year is the period between the last week in September and the second weeks in October due to a series of recurring events. A full report was published on Wednesday at GlobeInvestor. Following is a link:
Janet Yellen’s speech on Wednesday evening will be watched closely for clues when the Federal Reserve will increase the Fed Fund rate for the first time.
Other events could have an influence on equity markets this week include China’s latest PMI report on Thursday and threats of a U.S. government shut down.
Sectors
Daily Seasonal/Technical Sector Trends for September 25th 2015
Green: Increase from previous day
Red: Decrease from previous day
Calculating Technical Scores
Technical scores are calculated as follows:
Intermediate Uptrend based on at least 20 trading days: Score 2
Higher highs and higher lows
Intermediate Neutral trend: Score 0
Not up or down
Intermediate Downtrend: Score -2
Lower highs and lower lows
Outperformance relative to the S&P 500 Index: Score: 2
Neutral Performance relative to the S&P 500 Index: 0
Underperformance relative to the S&P 500 Index: Score –2
Above 20 day moving average: Score 1
At 20 day moving average: Score: 0
Below 20 day moving average: –1
Up trending momentum indicators (Daily Stochastics, RSI and MACD): 1
Mixed momentum indicators: 0
Down trending momentum indicators: –1
Technical scores range from -6 to +6. Technical buy signals based on the above guidelines start when a security advances to at least 0.0, but preferably 2.0 or higher. Technical sell/short signals start when a security descends to 0, but preferably -2.0 or lower.
Long positions require maintaining a technical score of 0.0 or higher. Conversely, a short position requires maintaining a technical score of 0.0 or lower.
Special Free Services available through www.equityclock.com
Equityclock.com is offering free access to a data base showing seasonal studies on individual stocks and sectors. The data base holds seasonality studies on over 1000 big and moderate cap securities and indices. To login, simply go to http://www.equityclock.com/charts/
Following is an example:
StockTwits released on Friday
Caterpillar breaking long-term trading range as prospects for industrials continues to look bleak
Technical action by S&P 500 stocks to 10:30 AM: Quietly bullish. Breakouts: $AZO, $NKE, $PG, $NVDA, $RHT. No breakdowns:
Editor’s Note: After 10:30 AM EDT, breakouts included Gannett and Este Lauder. Breakdowns included EQT Corp., Endo Pharma, PACCAR and Laboratory Co.
Valeant Pharmaceutical completed a Head & Shoulders pattern on a move below $271.00 Cdn.
$VRX.CA
Editor’s Note: RBC Capital downgraded the stock on Friday.
Disclaimer: Seasonality and technical ratings offered in this report by www.timingthemarket.ca and www.equityclock.com are for information only. They should not be considered as advice to purchase or to sell mentioned securities. Data offered in this report is believed to be accurate, but is not guaranteed.

Copyright © EquityClock.com


