by Dana Lyons, J. Lyons Fund Management
Given their relatively high yields, utility stocks have long been thought of as proxies, or at least competition, for bonds. And while that relationship is often overplayed (utility stocks are first and foremost, stocks), there is some credence to the notion. Since 1970, there is a 26% positive correlation in 2-month returns between 10-Year Treasuries and the Dow Jones Utility Average (DJUA). Although that’s not a hugely positive correlation, contrasted against the 10-Year vs. S&P 500 correlation which is slightly negative over that time, you can see there appears to be some influence from bonds on the behavior of utilities.
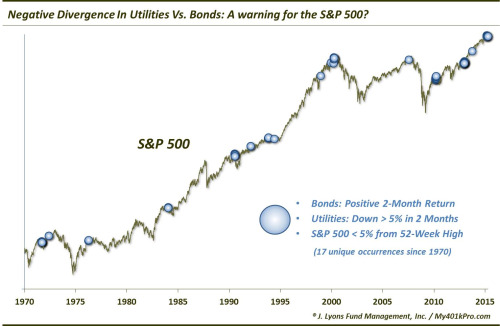
For that reason, while the two markets can go in opposite directions at times, it is fairly rare to see them diverge to the extent that they have recently. While bonds are at 2-month highs, utility stocks have actually lost ground over the past 2 months. As of a few days ago, the DJUA was actually down more than 5% over the previous 2 months. That wide of a divergence has only been triggered on roughly 5% of all rolling 2-month periods since 1970. Adding the qualifier that the S&P 500 is also trading within 5% of its 52-week high, the scenario is even more rare, having occurred on just 87 days (or 0.7% of the time) since 1970. (More on the S&P 500 below.)

What hath this divergence wrought in the past. Well, as far as the forward returns in both the 10-Year Treasuries and utilities are concerned…not much. Consider the change in 10-Year Yields following such divergences (i.e., Treasuries up over past 2 months, utilities down over 5% and the S&P 500 within 5% of its 52-week high).

It was common to see some reversion over the subsequent months as bonds gave up some of their gains and yields crept a bit higher. However, after 3 months, the performance of bonds was not too different than normal. And with utilities, we see the same thing.

Utility stocks did not persist in their negative divergence, instead scoring slightly above-average gains across all time frames. However, again the returns were not too different than normal.
Now for the S&P 500. We introduced the qualifier that the S&P 500 be trading near its 52-week high for a few reasons. One reason is just because it describes our current situation. We also wanted to test a potential theory. Perhaps the scenario whereby utility stocks begin to lag bonds near stock market highs describes a situation where stock investors are becoming more risk-averse, on the margin…i.e., they would rather hold bonds than utility stocks as bond proxies. The theory, or at least the by-product of such a theory, may have merit judging by the performance of the S&P 500 going forward. “Risk-aversion” was certainly evident over the subsequent period.

Returns for the broad S&P 500 were weak out to at least 6 months, and statistically significantly so. In fact, median returns were still negative 6 months later versus the typical 6-month return of nearly +5%. This certainly plays into the theory that these utility/bond divergences occur near market tops of some significance.
Breaking down the 87 occurrences yields 16 or 17 truly unique periods of utility/bond divergences. Indeed, many of them occurred at or near tops in the stock market.
- September 1971: S&P 500 slumped for 2 months before rallying.
- May 1972: S&P 500 made marginal new highs later in year before entering a cyclical bear market.
- April 1976: S&P 500 made marginal new highs later in year before entering a cyclical bear market.
- January 1984: S&P 500 immediately began a 6-month correction.
- July 1990: S&P 500 immediately began a 6-month correction.
- February 1992: S&P 500 went sideways for 6 months.
- October 1993: S&P 500 made marginal new highs soon after before going sideways for a year.
- June 1994: S&P 500 went sideways for 6 months.
- December 1998 & December 1999: Nothing notable.
- March-April 2000: S&P 500 immediately entered a cyclical bear market.
- July 2007: S&P 500 immediately entered a cyclical bear market.
- March 2010, November-December 2012, October 2013: Some short-term weakness but otherwise straight up.
- February-March 2015, April 2015: TBD.
As you can see, the track record for the S&P 500 following these divergences is quite dubious, at least prior to recent years. Whether the Fed’s quantitative easing policies have had something to do with it is unknown, but the recent lack of impact certainly must be weighed. However, while not 100% accurate, the historical tendency for this divergence between bonds and utility stocks to occur at or near tops is clear. Perhaps the most interesting thing is that, it hasn’t been near tops in bonds or utilities, but in the broad stock market. When considering the relationship between 2 variables, sometimes it pays to look elsewhere in determining the greatest impact.
________
“2+2=5 Connections” photo by Jerry Jappinen.
More from Dana Lyons, JLFMI and My401kPro.
The commentary included in this blog is provided for informational purposes only. It does not constitute a recommendation to invest in any specific investment product or service. Proper due diligence should be performed before investing in any investment vehicle. There is a risk of loss involved in all investments.
Copyright © J. Lyons Fund Management


