by J.C. Parets, All Star Charts
The bond market has been warning us all year to be skeptical of these new highs in the large-cap stock market indexes. The majority of publicly traded stocks are down year-to-date. But you won’t read that in the headlines. In fact, the small-caps are down 9% year-to-date and micro-caps are down over 10% this year. Mid-cap stocks are down this year, the NYSE Composite is down this year and the Dow Jones Industrial Average has done nothing. The S&P500 is barely up, and the Nasdaq100 being held up by a few names is doing the best so far. But what is the bond market telling us?
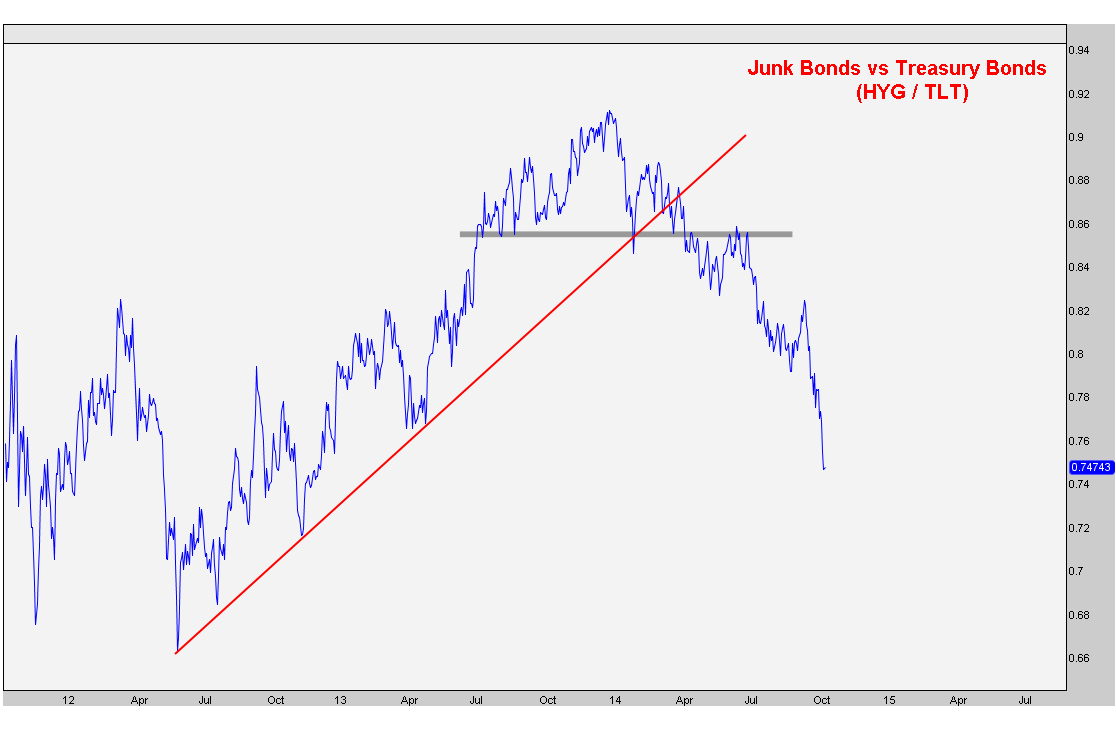
Today we’re taking a look at the Junk Bond vs Treasury Bond ratio. This is a similar concept to Discretionary vs Staples ratio we just looked at. If there is real risk appetite out there, managers would rather speculate in High Yield Junk Bonds than put money into US Treasury Bonds. One of them is speculative and the other one is theoretically the safest place in the world. When this ratio is rising, managers are more willing to put risk on. When this ratio is declining, managers are looking for a safe haven, for whatever the reason.
Here is a daily line chart of the HYG/TLT ratio to represent this particular dilemma amongst fund managers. We are currently hitting levels not seen since 2012. The bond market has been telling us the same thing that all of the other gauges of risk have been warning us about:
We want to see this ratio hitting new highs, not new lows. The bond market historically is said to be smarter than the stock market. Maybe that’s true and maybe it isn’t. Maybe they’re coincident indicators. But regardless, all year this ratio has been diverging vs the Large-cap averages. It appears that the few stocks that have actually gone up this year are now catching on to the lack of risk-appetite out there. I’d be watching $AAPL as it is one of the few mega-cap leaders that are still near highs and have yet to correct (see here) . If this breaks down, as the bond market is suggesting, this is going to cause an even bigger problem for the market overall.
Careful out there….
Copyright © All Star Charts


