“2014?”
by Jeffrey Saut, Chief Investment Strategist, Raymond James
December 30, 2013
Year-end letters are difficult to write because there is always a tendency to discuss the year gone by or, worse, attempt to forecast the coming year. Typically, when the media asks where the S&P 500 (SPX/1841.40) will be at the end of the new year, I tell them you might as well flip a lucky penny. Recall what Wall Street’s finest predicted for 2000 and 2008 even though there had been Dow Theory “sell signals” prior to the end of 1999 and 2007. Still, when pressed, I say the SPX will be higher, or lower at year’s end. If queried further, I give the media the S&P 500’s average yearly gain since 1926 of 10.4%. Recall that 5% of that gain is from earnings growth, 0.9% is attributable to Price/Earnings multiple expansion, but a large 4.5% is from dividends. With that as a disclaimer, I have been asked to write about what went right and wrong in 2013, and speak to the upcoming year.
Obviously 2013 was a great year, much of which this firm got right, as demonstrated by our Analysts’ Best Picks list, our Analyst Current Favorites list, the Raymond James Strong Buy list, Mike Gibbs’ Guided Model Portfolios, and most of our Asset Management Services products. My mistakes in 2013 were looking for bigger declines in late summer, and mid-November into mid-December, than we actually got. While those timeframes did provide the downside window of opportunity the timing models had targeted, the summer pullback was only about 6% and the late-year pullback amounted to a mere 2.4%. Another mistake was thinking gold was going to try to bottom in the April/May timeframe around the $1300/oz. level. However, if you adhered to my mantra used since the Dow Theory “sell signal” of September 1999, and did not let anything go more than 15% to 20% against you without taking some sort of defensive action to avoid the big loss, none of those wrong-footed “calls” should have cost you much money.
What I got right was, “You can be cautious, but do NOT get bearish.” I also got right the back-to-back 90% Upside Days (a pretty rare and bullish event) that greeted us at the beginning of last year suggesting stocks would be substantially higher one month, three months, six months, and a year later. The “no taper” call in September was correct, as was “It’s not Summers, it’s Yellen.” The major Dow Theory “buy signal,” when the D-J Transports traded out to a new all-time high, confirmed by the D-J Industrial Average, proved prescient. And worth noting is that we have had multiple Dow Theory “buy signals” over the course of 2013, reinforcing my belief that we are in a new secular bull market. Many investors do not believe that because they fail to understand how the markets can rise amid a sketchy news backdrop. As often stated, “The equity markets do not care about the absolutes of good or bad, but rather are things getting better or worse. I have maintained things are getting better.” Accordingly, I enter the new year in line with Dow Theory, believing the primary trend of the stock market is “up.”
Speaking to the news backdrop, consider this. For the past two years the markets have been confronted with numerous issues. The debt downgrade, the fiscal cliff, the sequester, the government shutdown, Dodd-Frank, rumors China would implode, the call that interest rates would skyrocket, Europe’s debt crisis, a potential U.S. debt default, Fukushima, the Arab Spring, Iran, North Korea, Iran, Egypt, Syria, etc., yet the equity markets traded higher. In contrast, except for Obamacare, this year could be relatively, news-wise, trouble free. Moreover, bond yields have already risen and are unlikely to move much higher in the short/intermediate term, tapering has been announced, GDP and earnings guidance has been raised, there is more political cooperation (budget deal, Yellen, WTO deal, EU bank accord, bailouts over, Mexico reform, etc.), the American Industrial Renaissance is alive and well, our oil independence is almost assured, and the central banks remain accommodative. To this accommodative point, it has been proven that quantitative easing lifts stock prices; and despite the taper announcement, the Fed’s balance sheet should still expand by some $435 billion in the new year (front-end loaded). As can be seen in chart 1, there has been a very tight correlation (R2) between the expansion of the Fed’s balance sheet and stock prices since 2009. If the Fed expands its balance sheet by another 12% over the coming year, it is conceivable the SPX could increase by another 12%. That would also be consistent with the S&P’s bottom-up, operating, earnings estimate increase of ~13% year-over-year ($122.11e vs. $107.40e; chart 2).
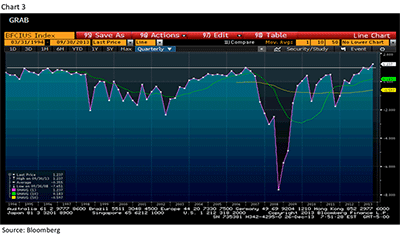
As for the economy, while many economists said not to get too excited about the revised 3Q13 real GDP report of +4.1%, because it was all about a build in inventories, I would argue those inventories were built because sales are stronger than most believe. For the past few months I have averred there is a tight R2 between gains in the stock market and Christmas sales. That correlation suggested Christmas sales would be up by roughly 4%, which is much better than anticipated. We will see if that “call” proves correct. I have also argued that many transactions are taking place in cash, which are not as readily captured in the empirical data suggesting the economy is stronger than the official figures show. Further, employment is picking up, purchasing managers indexes are improving, industrial production is on the rise, and the government should be less of a drag on the economy in 2014, all of which implies the GDP numbers should move towards 3%. While that’s below the typical trend for this phase of the business cycle, I have argued such growth is simple, but sustainable; and, could be the “sweet spot” for the stock market. All of this is being confirmed by Bloomberg’s U.S. Financial Conditions Index (BFCIUS) that has broken out to a 23-year high in the charts (chart 3). And if the banking complex is better/safer, it means the economy and stock market should do better. To be sure, it has been the financial system that has historically caused problems for the economy and for stocks.
Plainly, the U.S. macro uncertainty is falling with the budget deficit falling to a six-year low. That glide path should extend into 2014 with the CBO projecting a further drop in 2015 to a deficit of only 2.1% of GDP. Accordingly, I think a lot of things could indeed go right in 2014. The slowdown in housing, due to the increase in mortgage rates, should reverse now that mortgage rates have stabilized. A recent data point would be Lennar’s (LEN/$39.55/Strong Buy) admission – best month of the quarter was November in terms of sales and pricing. The capital equipment cycle (cap ex) should strengthen in 2014. In talks with companies’ senior management teams, they are telling me “We have put off investments in cap ex as long as we can because ‘things’ are just plain wearing out.” Furthermore, credit conditions are improving, loan demand is slowly picking up, M&A activity is increasing, dividends and buybacks are on the rise, profits are decent, inflation is contained, money is rotating out of most bond funds and (at the margin) into equity funds (given the amount of money that has flowed into bonds since 2008, this rotation has a lot further to go), the bad performance figures for 2008 are about to disappear from asset managers’ five-year track records, and the list goes on. All of this should make for interesting discussions in the new year when financial advisors meet with their clients to talk about future asset allocations. Unsurprisingly, most investors remain underinvested in equities. So what does this mean for the stock market?
As we begin 2014, I think the rally extends without much of a pullback. In fact, my sense is we could travel into the 1900 – 2000 zone on the SPX before succumbing to any meaningful correction. Right now the inflation-adjusted all-time high for the SPX is around 2060, but I doubt if we can make it there before getting some kind of “hiccup.” Currently, the SPX is better by 31.3% YTD and up about 40% from the June 2012 low without any meaningful correction. The historical median drawdown following such a rally is between 6% and 7% over the next three months and between 10% and 12% sometime during the next 12 months.
Drilling down into investment selections, given the slowing earnings momentum, growth stocks should outperform value stocks. This growth theme favors the Information Technology and Healthcare sectors. These two macro sectors are trading at one or more standard deviations below their historical valuation norms, hopefully providing some downside cushion in the event of a correction. Additionally, Technology is trading at an ROE of 22% versus the SPX’s 15%. However, value stocks are largely clustered in the Financials, which we also favor for reasons often mentioned in these missives. Companies increasing their cap ex budgets to position themselves for future growth should do well, as should firms with high operating leverage as they stand to benefit from an acceleration in sales growth as GDP increases.
Price/Earnings (P/E) multiple expansion has contributed heavily to the upward path of the equity markets over the past few years and there has been a lot written about that. In 2014 it is doubtful P/Es will expand very much because of the tapering announcement and fears interest rates will rise. Yet even if the SPX just trades at its current P/E multiple (17x), it suggests an SPX price target of 2076 by the end of 2014 if the earnings estimates are anywhere close to the mark. Of course that brings about cries that elevated profit margins cannot remain where they are, and therefore must revert to their historic mean hurting earnings, an argument from the negative nabobs we have heard since 2010; and I just don’t believe it. Many companies are moving their IT needs to the “cloud,” which saves a huge amount of money permitting margins to stay wide. Then there is the change in the composition of goods produced in this country that has moved from low margined goods to higher margined goods like jet engines. Or, how about the accounting term “income from affiliates,” which means a parent company has a minority stake in another company that brings in income but doesn’t record revenues associated with that stake, suggesting 100% margins. So, no, I do not buy the margin compression in 2014 argument.
Putting the margin compression argument to bed surfaces another argument from the naysayers about the Shiller “Cyclically Adjusted P/E Ratio” (CAPE Ratio), that uses a P/E ratio based on average inflation-adjusted earnings from the previous 10 years. Hereto, in past missives I have discussed that, with the 2008/2009 experience (bankruptcies, write offs, etc.), I don’t think the CASE’s current high P/E reading (approx. 25x) is a valid measurement. In a recent commentary, Michael Aronstein of Marketfield Asset Management explains it much better than I. To wit:
Consider the arithmetic. For a company that has grown its real earnings at 10% for a decade, the ten-year average will be about 30% below the level of the current year. On this basis, the smoothed P/E ratio will be about 50% higher than what is indicated by analysts or shown in the newspapers. If a company selling at twenty times current earnings and growing real earnings at around 10% per annum should really be regarded as selling at thirty times earnings for purposes of risk analysis, there must be some overriding variable that is being overlooked by markets.
Mr. Aronstein goes on to note:
We would suggest that such an approach is much more useful following periods of unusually depressed earnings derived from exogenous shocks rather than as a means of pointing to unsustainably elevated P/E ratios. In the aftermath of a serious economic downturn, it is very useful to have a device that prevents being caught in a spiral of negativity. Normalizing earnings higher to reflect the temporary nature of recessions and depressions is a very useful means of countering the emotional tendency to sell at lows.
In conclusion, in the very short term the equity markets are overbought (chart 4), but it has been repeatedly demonstrated in 2013 that such readings have been greeted at worst with moderate pullbacks and at best with a sideways consolidation. I would expect the same here. After years of modest growth, the U.S. economy looks poised to gain momentum in 2014. At this stage in the business cycle, uncertainty tends to be on the decline and confidence typically is on the rise. That causes investors to move from safer assets (cash and bonds) to ones with better returns (equities). This eventually leads to excessive optimism. If the markets remain on their current path, excessive optimism should arrive in the February – April timeframe. At that point, the equity market should become vulnerable to a more meaningful decline. Nevertheless, as long as the economy avoids a recession, and we think it will, the odds of a true bear market remain de minimis. My asset allocation is to overweight U.S. equities (Japan remains interesting) and underweight bonds with emphasis on the short end of the fixed income curve. High yield could still have some upside, as could “credit.” I would continue to underweight Emerging Markets (EM) in the near term, although some of them look very cheap. Commodities should also be underweighted in the near/intermediate term, including precious metals, until EM growth accelerates and the U.S. Dollar Index weakens. As for the U.S. dollar, it looks set to strengthen against most currencies as interest rates grind higher. This is yet another reason to underweight EM and commodities.
In addition to my often-stated macro themes (the election of smarter policymakers and therefore smarter policy, the American Industrial Renaissance, Energy Independence, the Digitization of Society, Mass Consumerism, Modern Medicine), there are some major disruptive themes that are reshaping industry. They include: 1) 3D printing, 2) LED lighting, 3) Cancer Immunotherapy, 4) Mobil adoption and the convergence of devices, and 5) Big data ... to name but a few. The year ahead for the U.S. economy, and markets, should be dependent on continuing earnings momentum, policy initiatives out of the D.C. Beltway, fiscal and monetary policy, interest rates, and the dollar; all of which causes me to employ a more flexible investment style for 2014 than I used in 2013.
The call for this week: Once again, over the weekend I read that, at 58 months, this rally is too long and can’t continue. But, they are measuring it from the March 2009 “nominal low.” We don’t measure the 1982 to 2000 secular bull market from its “nominal low” of December 1974, but rather from its “valuation low” of August 1982. If we measure this bull move from its “valuation low” of October 2011, the current rally is 26 months long, not 58 months. Merry New Year!
Copyright © Raymond James


