For this weeks edition of the SIA Equity Leaders Weekly, we will be updating the U.S. Dollar vs. Canadian Dollar, a subject that we touched on in early May and July, as we saw a potential bullish pattern develop. Secondly, we will update the Crude Oil outlook as Commodity prices overall have been volatile, but continued to relatively underperform versus the other Asset classes.
United States Dollar/Canadian Dollar (USDCAD)
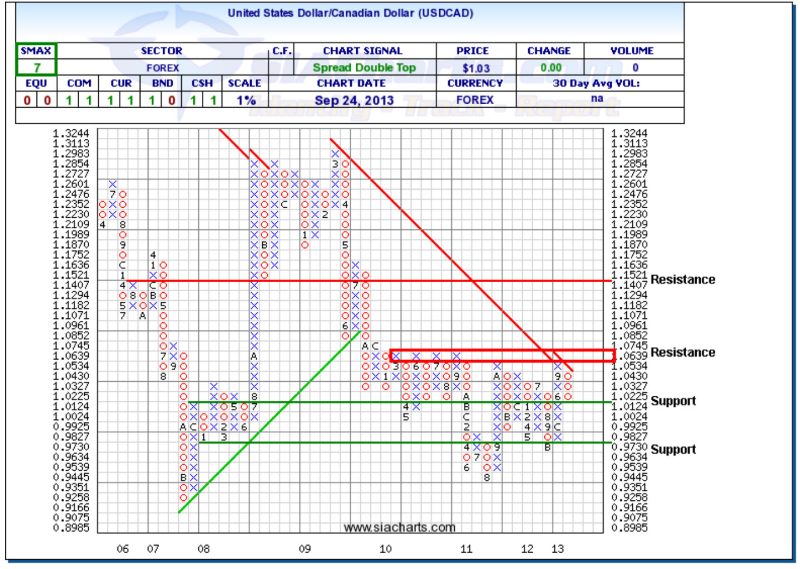
Our first chart today is the USDCAD. Since we last looked at this chart in July, it was up against some key resistance and we recommended to keep a close eye on if it could break through these key levels since it has been in a consolidation pattern since the latter part of 2010 with the exception of a spike down in 2011. Looking to the chart today, we can see that the resistance did hold and that the USDCAD has moved down to the support level at 1.0124.
The next support level that could be challenged, if the weakness continues, is found above 0.973. Strong resistance will remain in the 1.0639-1.0745 area and something to keep a closer eye on now is the downwards trendline. If the USDCAD reverses back into a column of X's on a 1% chart, this will finally break the long-term trendline that has been in place since 2009. We have seen U.S. Equities dominate their Canadian counterparts overall for the past two years. So we want to keep a close eye on this currency relationship to see if the USDCAD can move above the key resistance levels and long-term trendline, which could skew this relationship even more in favor of U.S. Equities or if the consolidation pattern the USDCAD has been in for years will continue.
Click on Image to Enlarge
Crude Oil Continuous Contract (CL.F)
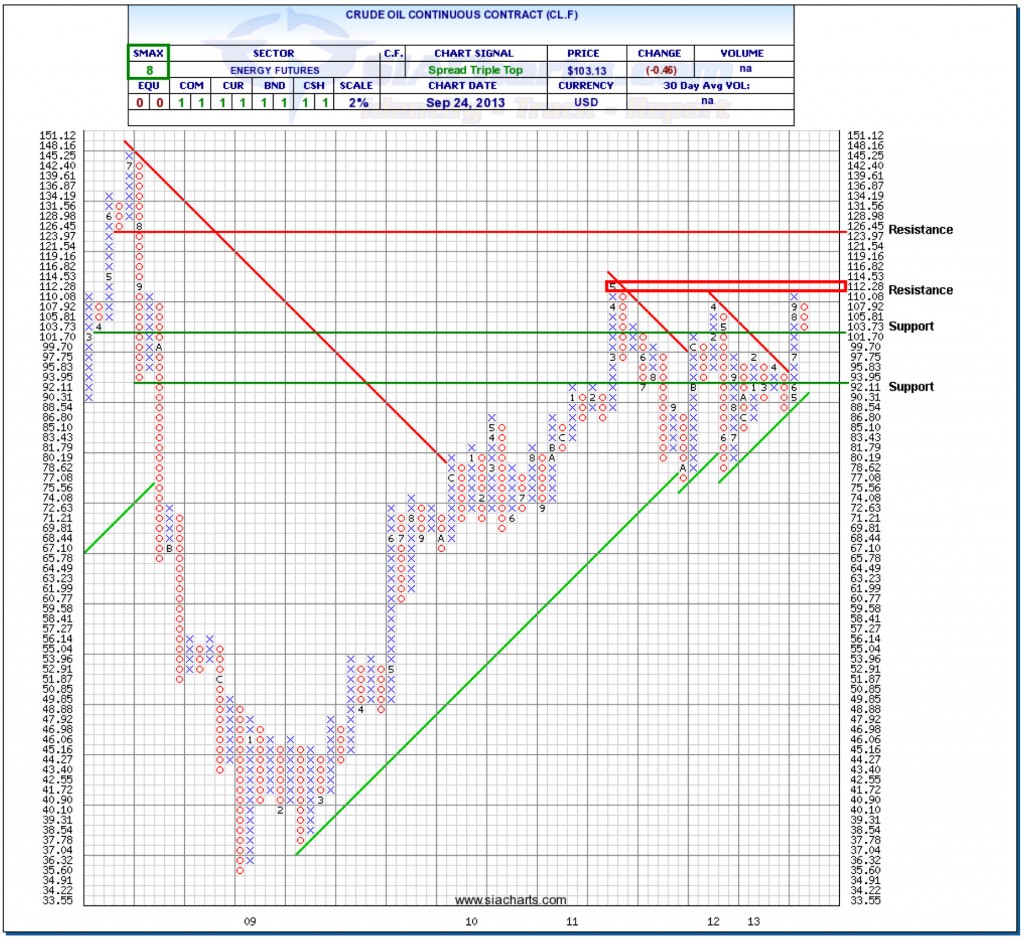
After an overall lackluster start to the year, Crude Oil had been moving strongly upwards starting in May, and that continued all the way into September, but most recently it has now pulled back to our first support level at $101.70. Further weakness could then see the next support at $92.11 come in to play, with the rising trend line directly below that providing additional support. Should the rally in Crude resume, then resistance is in the $112-$114.50 range, with room to potentially move to $126.45 above that.
We continue to monitor the important relationship in the USDCAD closely as it has been correlating with the relative outperformance we have been seeing in US Equity over CAD Equity. It also has been influencing the performance of Commodities, which has been dragging down the performance of the TSX over the past couple of years.
Click on Image to Enlarge
SIACharts.com specifically represents that it does not give investment advice or advocate the purchase or sale of any security or investment. None of the information contained in this website or document constitutes an offer to sell or the solicitation of an offer to buy any security or other investment or an offer to provide investment services of any kind. Neither SIACharts.com (FundCharts Inc.) nor its third party content providers shall be liable for any errors, inaccuracies or delays in content, or for any actions taken in reliance thereon.


