The slowdown in housing due to higher mortgage rates is becoming more evident in the data for that market. This comes during a time when the Fed is making a crucial decision about tapering quantitative easing, which is causing market uncertainty to rise further.
by Scott Minerd, Chief Investmnet Strategist, CIO, Guggenheim Partners
Economic data continues to confirm that housing is the key pillar supporting continued U.S. economic expansion, generating 40 percent of second quarter growth. Concerns, therefore, about the effects of higher mortgage rates, up by over 100 basis points since May 1, 2013, are justifiable.
Recent data releases have been mixed and much housing data lags by several months. Two weeks ago, housing starts data appeared positive, ticking up to 896,000 from 846,000, with the biggest contributor being multi-family housing. But last Friday, new home sales came in at their lowest level in nine months, down 13.4 percent from June. New home sales are booked when a contract is signed, a key difference from existing home sales, which are booked months later when the deal closes. As such, new home sales are the most current indicator of housing activity. This makes the recent collapse of new home sales exceptionally disturbing. All told, there has been a 20.7 percent decline in new home sales in June and July. We would view any other business that experienced a 20 percent decline in activity over a two month period as in a highly difficult position.
Putting all of this together, there is strong evidence that the economy is eroding below the surface. Importantly, this comes at a time when the U.S. Federal Reserve is under increasing scrutiny over whether it will maintain its apparent commitment to tapering its bond-buying after the Federal Open Market Committee’s September 19 meeting. My view is that it appears likely that the Fed will continue signaling that a reduction of its bond purchases will happen, but that the central bank will probably start hinting about taper-lite, or a smaller reduction of its bond buying, than it signaled back in June. As all this plays out, it appears as though volatility will continue to rise as we head into September.
Chart of the Week
Further Confirmation of U.S. Housing Slowdown
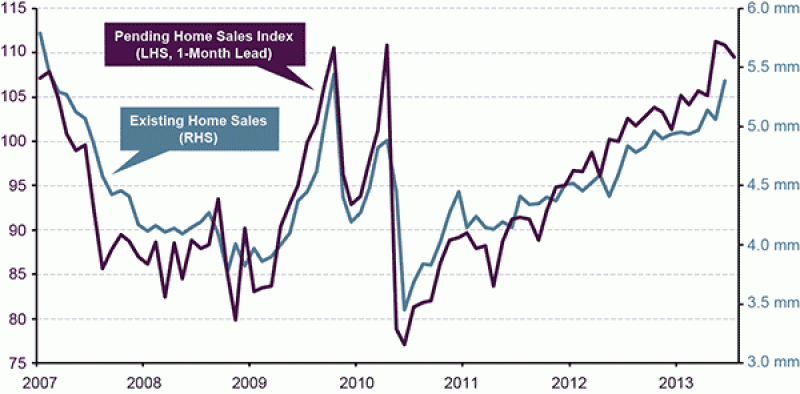
Pending sales of U.S. homes declined 1.3 percent in July, the largest monthly fall this year, following a 0.4 percent decrease in June. Pending home sales tracks the number of signed real estate contracts for existing homes and serves as a leading indicator for existing home sales. Given the fall in pending home sales and the plunge in new home sales, we expect existing home sales to follow this declining pattern soon.
U.S. PENDING HOME SALES VS. EXISTING HOME SALES

Source: Bloomberg, Guggenheim Investments. Data as of 7/31/2013.
Economic Data Releases
U.S. Housing Market Begins to Show Impact from Higher Mortgage Rates
- New home sales plunged 13.4% in July to an annualized pace of 394,000. July’s decrease was the largest since May 2010, and the level of home sales is the lowest this year.
- Pending home sales fell 1.3% in July, the largest drop this year.
- The S&P/Case-Shiller 20 city composite house price index decelerated to 12.1% year-on-year growth in June, down from 12.2% in May. It was the first decrease in yearly growth since December 2011.
- The FHFA house price index showed prices rose 0.7% in June from May, the 17th consecutive month of rising prices.
- The index of U.S. leading indicators increased 0.6%, led by gains in the financial indicators.
- U.S. durable goods orders fell by the most in one year in July, down 7.3%. Excluding transportation, orders were down a more-than-expected 0.6%.
- The Conference Board’s index of consumer confidence rose more than expected to 81.5 in August after falling in July.
- Jobless claims increased for the week ended August 17th, up 13,000 to 336,000.
- The Richmond Fed manufacturing index jumped to 14 in August, the highest level since March 2011.
Improvement in Europe Continues, China Manufacturing Bounces Back
- Euro zone PMIs were better than expected in August, showing expansion in both manufacturing and services. The composite PMI increased to 51.7.
- German PMIs beat expectations. The manufacturing PMI rose to 52.0, the second month of expansion.
- PMIs in France were below forecasts in August, with the manufacturing PMI unchanged at 49.7 and the services PMI falling.
- Euro zone consumer confidence increased to -15.6 in August, a two-year high.
- The IFO Business Climate Index rose for a fifth straight month in August to 107.5, the highest level in 16 months.
- The GfK index of consumer confidence in Germany ticked down to 6.9 in the September reading from 7.0 in August.
- U.K. GDP grew for a second straight quarter, up 0.7% in the second quarter. Growth was led by strong investment spending as well as exports.
- The HSBC China manufacturing PMI for August rebounded to 50.1 after three months of contraction.
Copyright © Guggenheim Partners


