Upcoming US Events for Today:
- Weekly Jobless Claims will be released at 8:30am. The market expects 345K versus 354K previous.
- Personal Income and Spending for May will be released at 8:30am. Personal Income is expected to show a month-over-month increase of 0.2% versus no change (0.0%) previous. Personal Spending is expected to increase by 0.4% versus a decline of 0.2% previous.
- Pending Home Sales for May will be released at 10:00am. The market expects a month-over-month increase of 1.0% versus an increase of 0.3% previous.
- Kansas City Fed Manufacturing Index for June will be released at 11:00am. The market expects 4.0 versus 2.0 previous.
Upcoming International Events for Today:
- German Unemployment Rate for June will be released at 3:50am EST. The market expects no change at 6.9%.
- Great Britain GDP for the First Quarter will be released at 4:30am EST. The market expects a quarter-over-quarter increase of 0.3%, consistent with the previous report.
- Eurozone Economic Sentiment for June will be released at 5:00am EST. The market expects Consumer Confidence to show -18.8, consistent with the previous report. Industrial Confidence is expected to show -12.3 versus -13 previous.
- Japan CPI for May will be released at 7:30pm EST. The market expects no change (0.0%) on a year-over-year basis versus a decline of 0.4% previous.
- Japan Industrial Production for May will be released at 7:50pm EST. The market expects a year-over-year decline of 2.4%.
The Markets
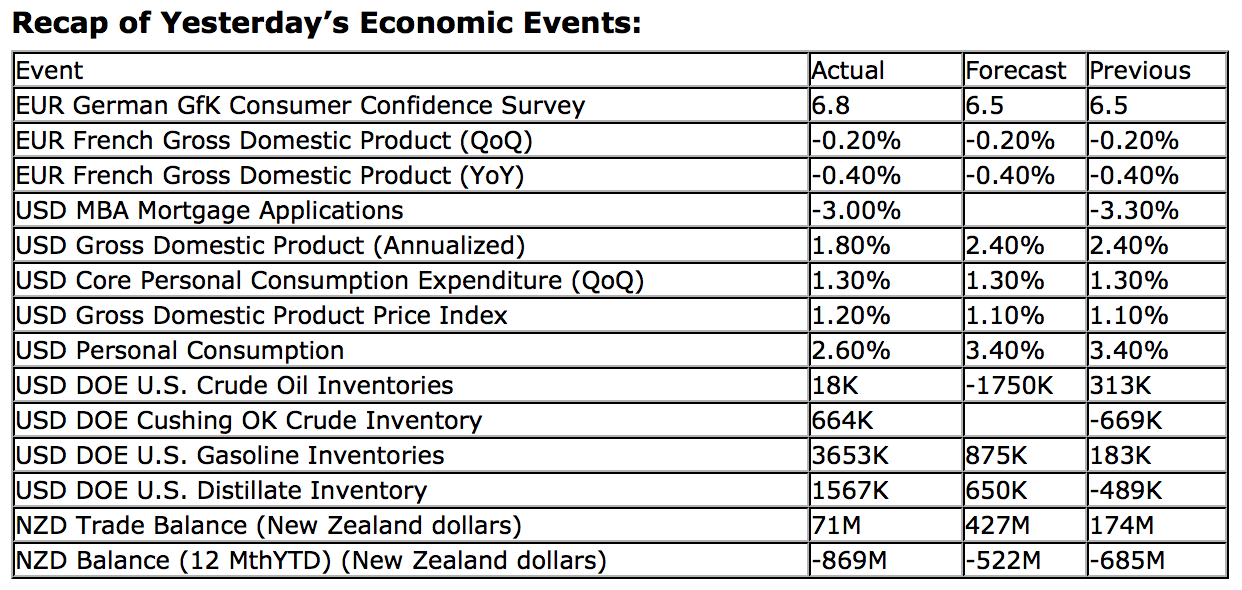
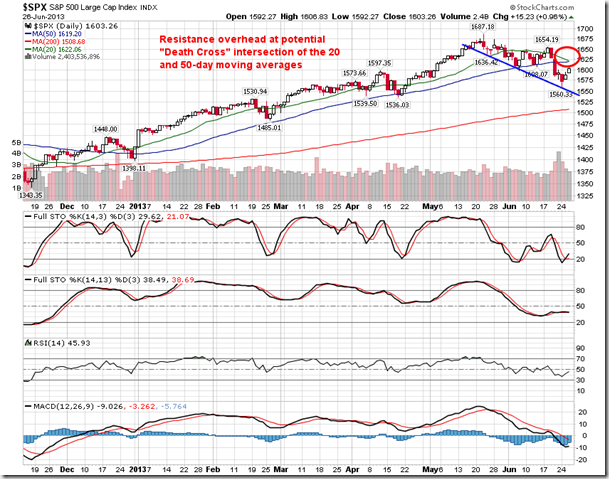
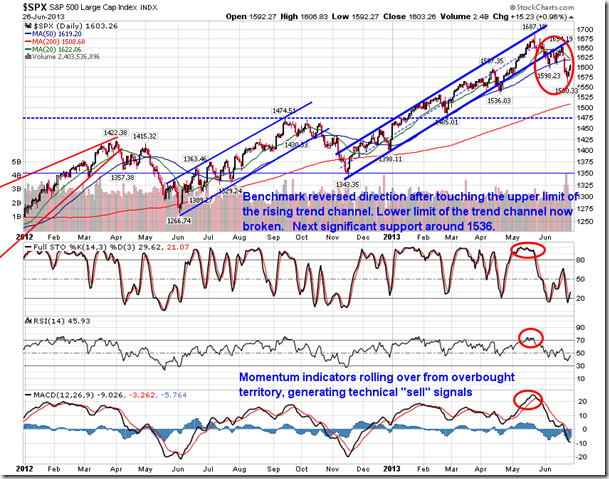
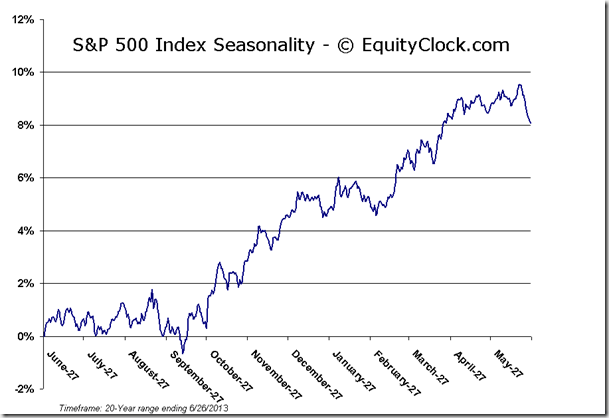
Markets traded higher for a second day despite a revision lower to first quarter GDP. GDP was revised lower by six-tenths of a percent to 1.8% growth, significantly less than the expectation of 2.4%. Gains on the day centered around defensive assets as Utilities, Health Care, and Consumer Staples topped the leader-board. The S&P 500 is attempting to claw-back recent losses recorded over the last couple of weeks; resistance is implied at the 20 and 50-day moving averages, which are converging on one another in a potential “death cross” scenario. Short-term positive seasonal tendencies are ahead as the calendar crosses over to a new quarter and as investors speculate upon the earnings season ahead.
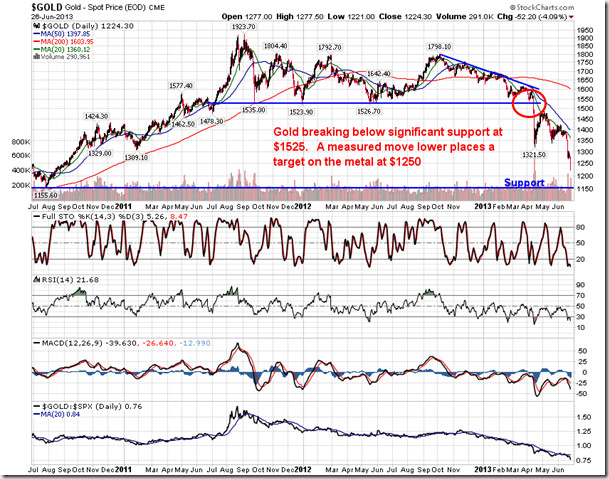
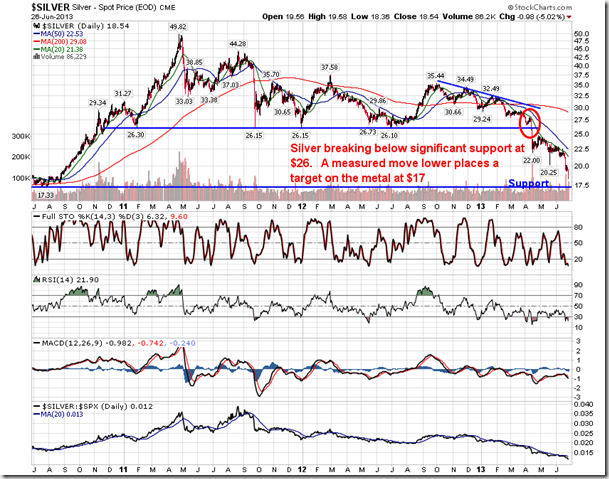
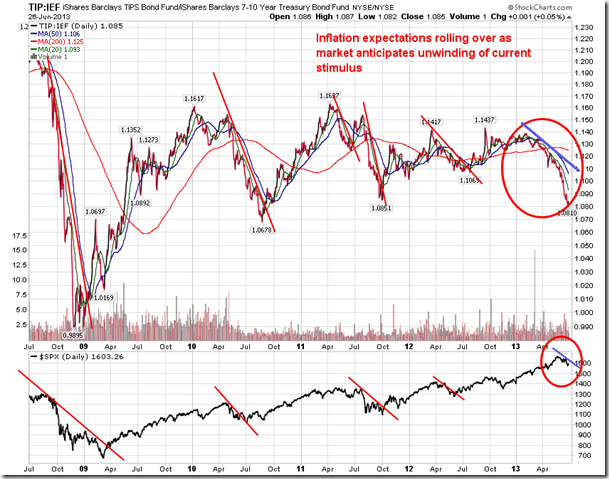
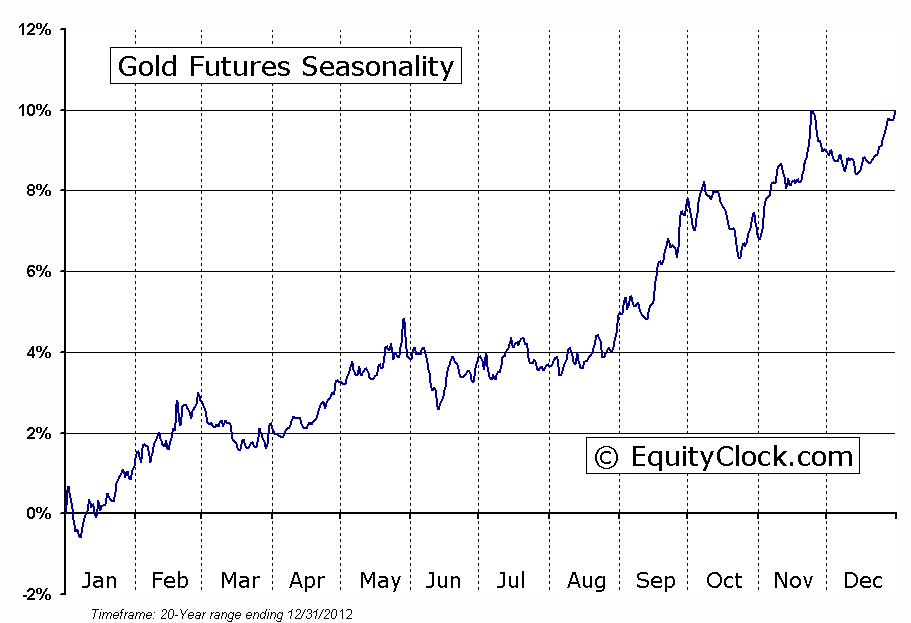
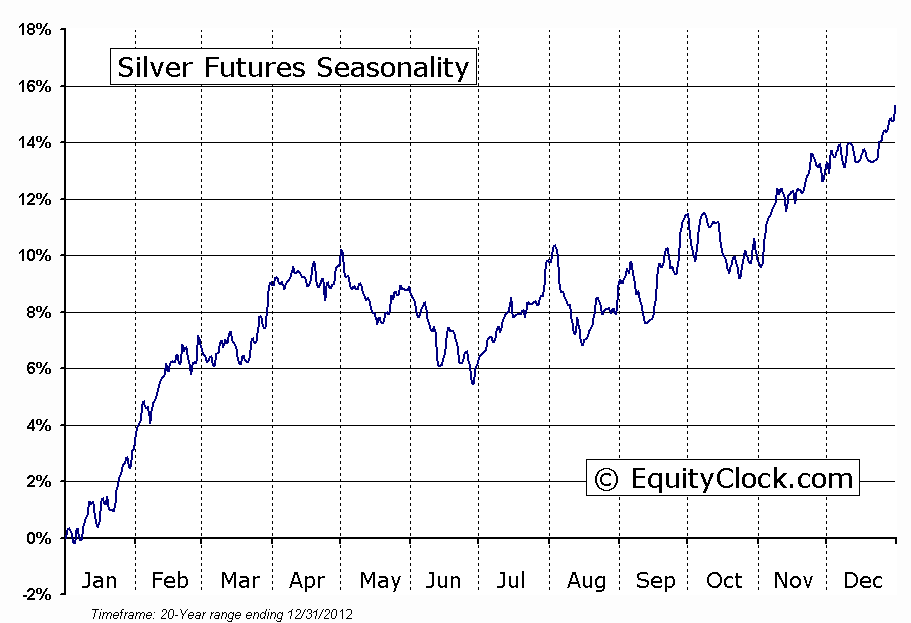
Despite the fairly strong equity market returns, the talk amongst investors was the plunge in the price of Gold and Silver. Gold fell by 4.09% while Silver recorded a decline of 5.02%. Gold has now fulfilled the downside target implied by the descending triangle pattern that was charted around the turn of the year, while Silver remains about $1.50 off of a similar target. Significant support for Gold and Silver can be found at $1155 and $17, respectively. The metals have been falling as a result of a decline in inflation expectations stemming from the prospect of Fed tapering of current monetary stimulus. Gold enters a period of seasonal strength in the month of July, running through September, based on the tendency for increased equity market volatility and buying demand leading into the Indian wedding season and Christmas. The question becomes, will the trade work this year? The trend as of present is clearly negative with little evidence to suggest a change of trend is on the horizon. The metal is trading substantially below its 20 and 50-day moving averages and technical indicators are at oversold extremes. A bounce, at the very least, is a reasonable speculation, however, further evidence is required to confirm a sufficient footing to justify a seasonal 3-month rally. Careful monitoring of the trade is warranted. Should the metal decline to the $1155 level of support, the intermediate risk-reward ratio of the trade may become so appealing that taking position would seem logical given the positive seasonal tendencies ahead.
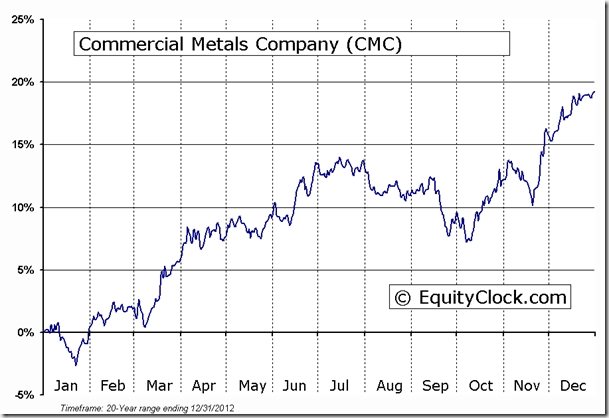
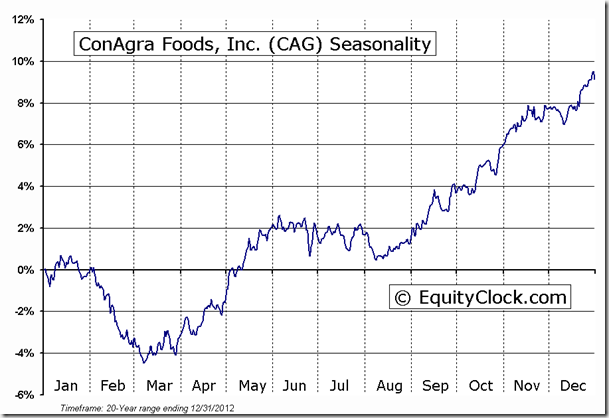
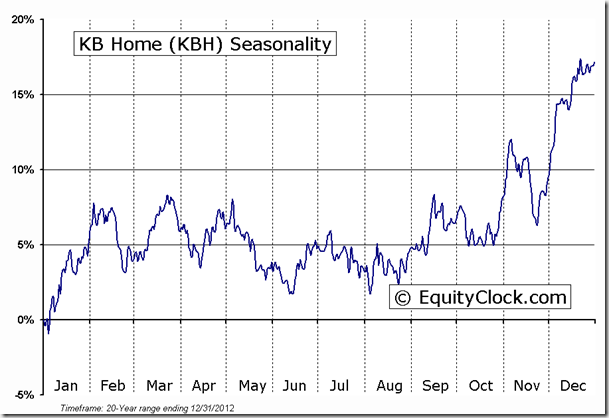
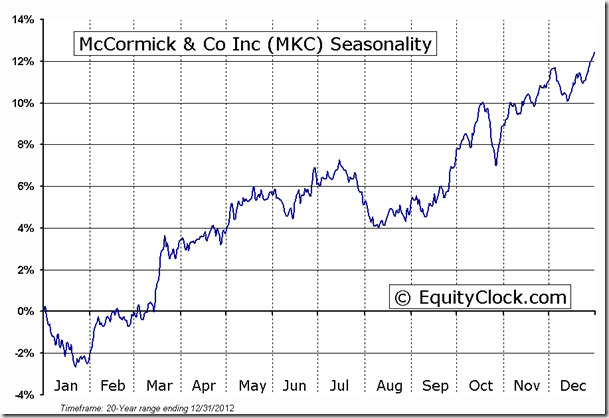
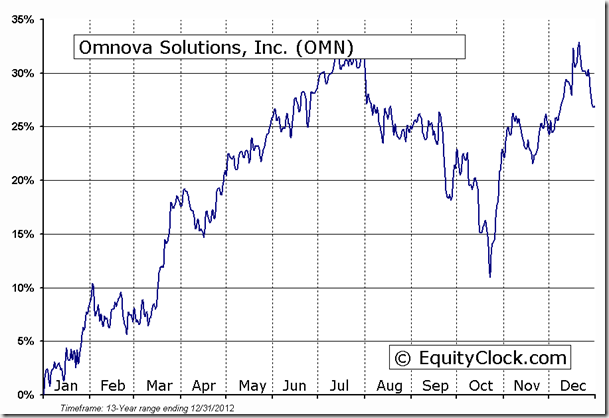
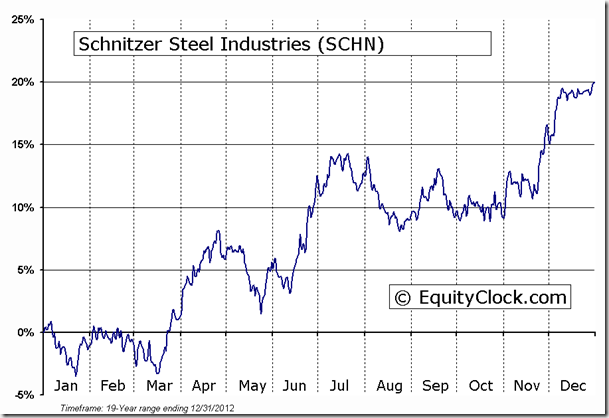
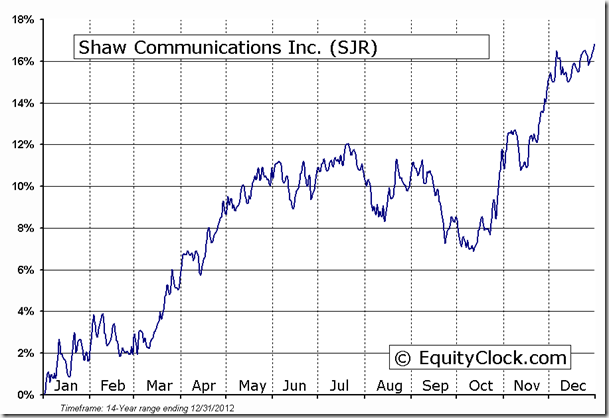
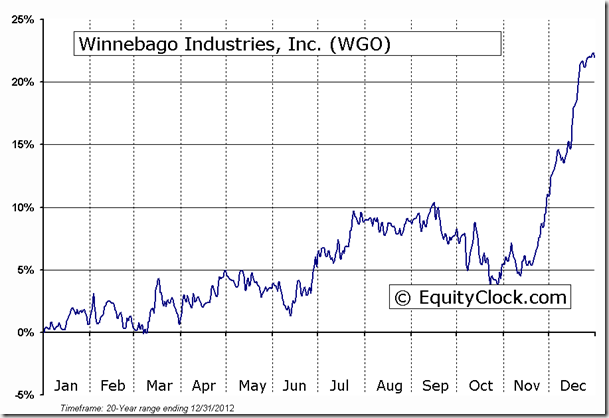
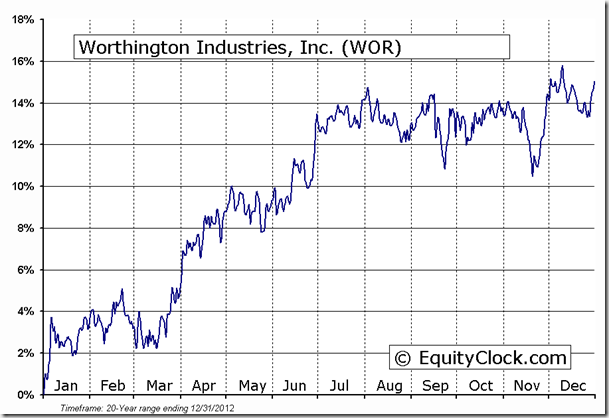
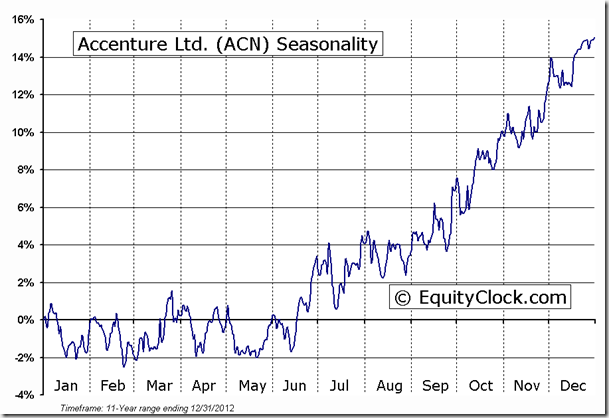
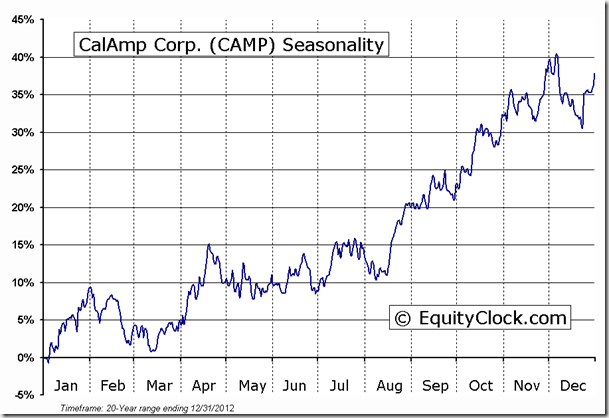
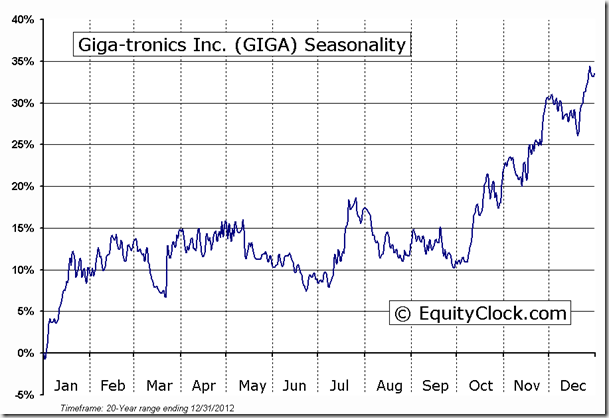
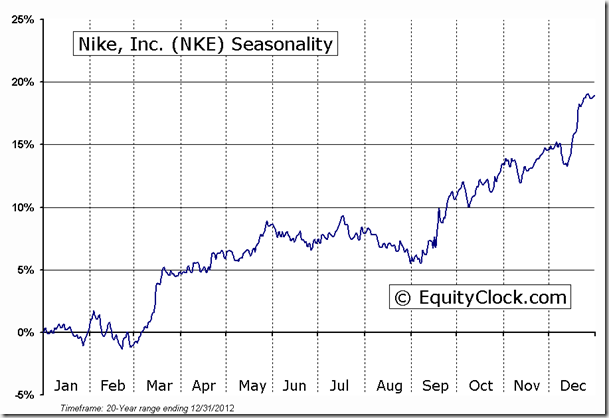
Seasonal charts of companies reporting earnings today:
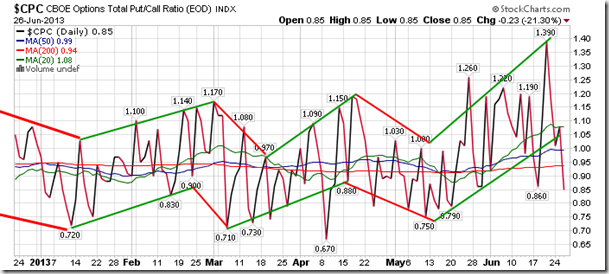
Sentiment on Wednesday, as gauged by the put-call ratio, ended bullish at 0.85. This is only the second sufficiently bullish reading recorded all month.
S&P 500 Index
Chart Courtesy of StockCharts.com
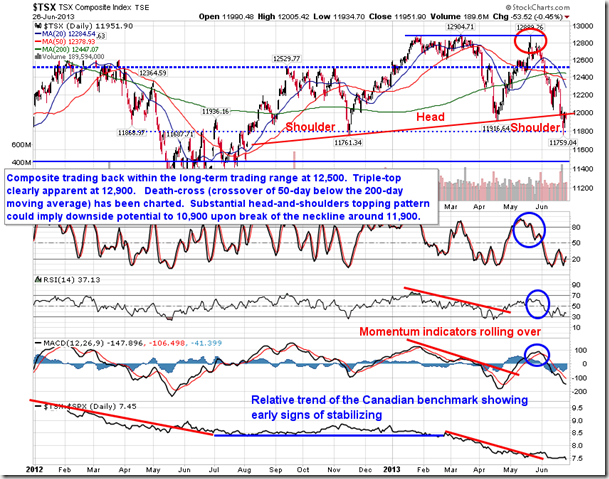
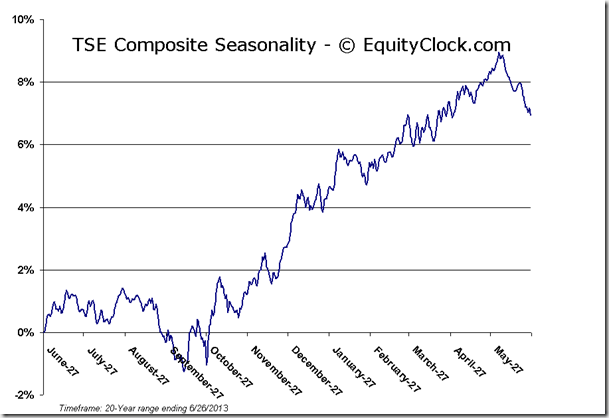
TSE Composite
Chart Courtesy of StockCharts.com
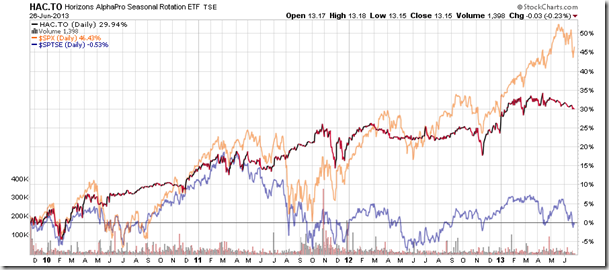
Horizons Seasonal Rotation ETF (TSX:HAC)
- Closing Market Value: $13.15 (down 0.23%)
- Closing NAV/Unit: $13.15 (up 0.01%)
Performance*
| HAC.TO |
* performance calculated on Closing NAV/Unit as provided by custodian
Click Here to learn more about the proprietary, seasonal rotation investment strategy developed by research analysts Don Vialoux, Brooke Thackray, and Jon Vialoux.


