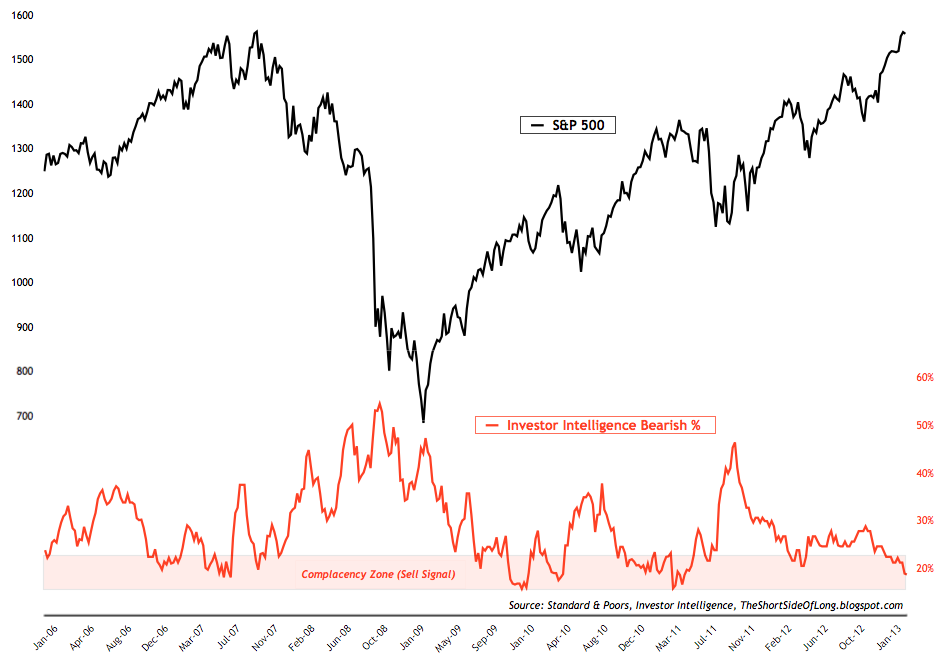
It has been awhile since I discussed equity market sentiment and that is because not much has changed. Bulls continue to get more bullish, the sun is shining and everyone is singing "Kumbaya my lord". It is worth noting that overly optimistic readings we saw earlier in the year have put a stop to a rally in variety of risk assets, including:
- Eurozone Equities & Emerging Markets
- European Euro & Canadian Dollar
- High Grade Copper & Brent Crude Oil
Therefore, if you live outside of US, your local equity market has most likely already started to decline. On the other hand, to everyones amazement, the US equity market has continued to rise all on its own in vertical fashion and therefore deserves a nickname "Teflon Rally". However, can the S&P 500 stay bullet proof all on its own?
Chart 1: Investor Intelligence bearish sentiment
Source: Short Side of Long
I personally doubt it. I have been bearish on the equity markets since the later parts of 2012 and yet the rally continues higher, so I won't blame you if you are sick and tired of hearing me warn about the potential sell off.
Nevertheless, all of the warnings remain in place and sentiment conditions continue to worse (indicators point to a contrary outcome). The latest sentiment update will be arriving later on today (early morning US time), courtesy of Investor Intelligence, so I thought it would be nice to include it as today's chart of the day. Chart 1 shows that the current level of bearish advisors has fallen to alarmingly low levels, commonly linked to major market peaks. A quick glance at the chart shows similar readings in 2007, 2010, 2011 and presently.
Table 2: Statistical study indicates a major sell off potential

Source: Merrill Lynch
One of the recent Merrill Lynch research notes I received in my inbox actually discussed the same sentiment conditions, so it is worth sharing. The table above shows a two decade historical study of Investor Intelligence bearish readings relative to the equity market performance. The study assumes that when bearish readings fall below 25%, equities are considered to be overbought.
From the data above, we can make a few interesting observations:
- The current duration of complacency seems to be the longest in two decades and has also registered the lowest reading of all the previous conditions.
- Apart from the tech euphoria of 1998, the equity market tends to peak within a few days to a few weeks after extreme bearish readings occur.
- The average and median decline following such a streak of complacent readings by II Bears indicates a high possibility of a bear market (20% decline from peak to trough).
Copyright © Short Side of Long


