In this week's edition of the SIA Equity Leaders Weekly we will be doing an update on the 30 Year Interest Rate in the U.S. bond market and take a look at Gold, a Commodity that can be effected by changes within the Bond/Currency markets.
CBOE Interest Rate 30 Year (TYX.I)
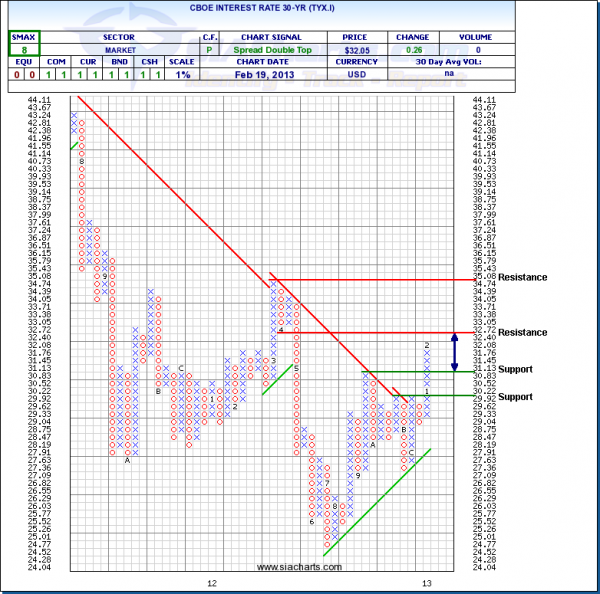
The first chart we are looking at is the CBOE 30 Year Interest Rate. In our January 24th edition of the ELW we commented that the 30 Year rate had moved above its downtrend line, an event that until recently had only happened during equity crisis.
Since that update we have seen the interest rate on the long end of the curve continue to rise from 3.07% to 3.205%, a 4 box increase on the chart. This move finds us close to our first resistance level below 3.272% with room to the 3.508% range if it is breached. To the downside support moves up to 3.083%.
For those invested on the long end of the curve in the U.S. this recent activity has eroded capital from your bond investment. What may not be obvious to some though is the potential strength this move could put on the U.S. Dollar and its effect on Commodity prices. We will take a look at the Gold chart below to see.
Gold Continuous Contract (GC.F)
Back on January 10, 2013 in the Equity Leaders Weekly we looked at a comparison chart between the SPY (SPDR S&P 500 ETF) and GLD (SPDR Gold Trust) which showed that the strength was in the SPY. Since that point, the SPY is up almost 3% and GLD is down almost 6%.
With the strength that is being displayed in the 30 Year Yield, a strengthening U.S. Dollar may continue to put downward pressure on Gold.
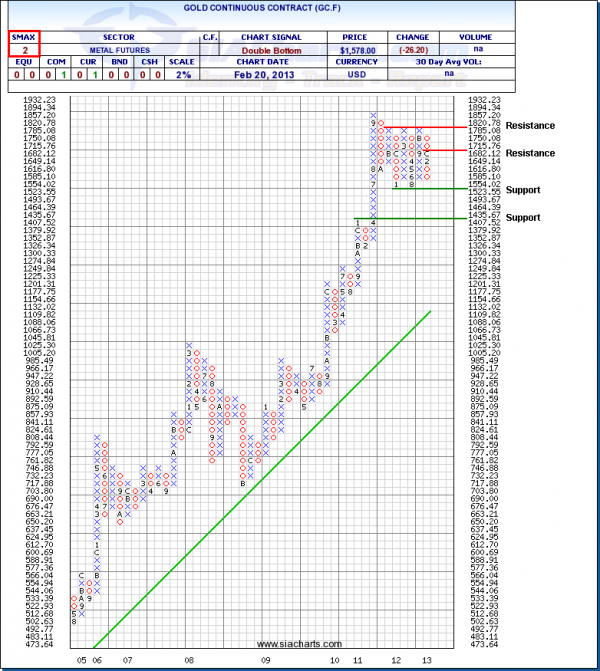
Looking at the chart to the right we can see that after a run up in August through to November 2012 to the top of the channel at $1820.78, Gold has now pulled back and is again approaching the bottom of the channel at $1523.55. Further weakness could then see the next support level around the $1400 area.
Currently the SIA Asset Allocation Model is showing Commodities in the 7th position (out of 7) and the Metals and Mining sector is ranked 31st (out of 31).
With the SMAX at 2, Gold continues to show weakness against the other asset classes.


