The Limits of Monetary Policy
by Scott Minerd, Chief Investment Officer, Guggenheim Partners
With unemployment levels remaining stubbornly elevated, investors should not expect a reversal of quantitative easing by the Federal Reserve in 2013.
- CIO Commentary by Scott Minerd
"The Federal Reserve is likely to continue with its asset purchase program through all of 2013. This is because the pace of improvement in the jobs market is not going to be as robust as that which would be necessary to resolve the long-term structural unemployment problem. Even once a point has been reached where the Fed would deem the unemployment level acceptable, which current guidance suggests is around 6.5%, they will still be concerned about exiting Quantitative Easing (QE) too abruptly. By then, the Fed will regard QE as an insurance policy against the risk of the economy starting to slide. At some point though, the Fed will need to step away and let market forces take over once again. Problems could arise when the market begins to try to anticipate the termination of QE or the reversal of the increase in the Fed’s balance sheet. By this time next year, the Fed’s balance sheet could be as large as four trillion dollars."
Economic Data Releases
U.S. Data Mostly Encouraging
The data in the U.S. over the past week has showed encouraging signs in the face of the Fiscal Cliff. Retail sales were up 0.3% MoM in November after a decline in October. Industrial production advanced 1.1% MoM in November, the fastest since December 2010. Initial jobless claims fell to the lowest level since early October, and the consumer price index fell 0.3% MoM in November, as recent pressures on energy prices subsided. In the housing market, mortgage applications were up on the week and the NAHB index of homebuilder confidence rose to the highest level since April 2006. One negative report was the Empire Manufacturing Survey, which fell to -8.1, showing a contraction for the fifth straight month.
Eurozone Contraction Slows, China Rebound Continues
Industrial production in the eurozone fell for a second consecutive month by 1.4% MoM in October. However, the eurozone PMI composite rebounded to a nine-month high of 47.3 in December, suggesting that recent contractions in eurozone economic activity are slowing. Prices across the eurozone remained largely stable in November as the Eurozone CPI remained at 2.2%, while ticking down to 1.9% in Germany, and 1.6% in France. In Japan, industrial production grew for the first time since June, with 1.6% MoM increase in October. The Tankan Index of Large Japanese Manufacturers, however, sank to -12.0 in the fourth quarter, the lowest since March 2010. The HSBC manufacturing PMI in China rose to 50.9 in December in the preliminary release, indicating that manufacturing activities expanded for a second consecutive month.
Chart of the Week
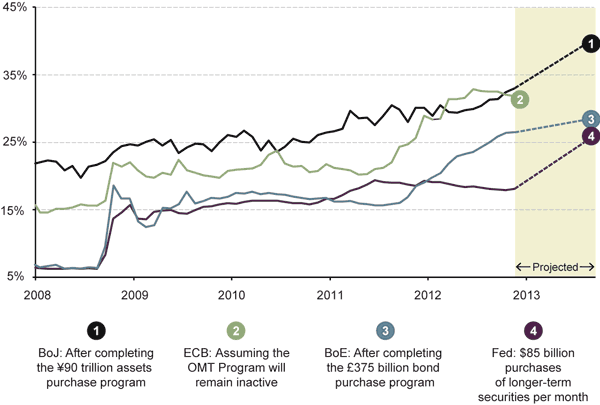
Global Major Central Banks’ Total Assets as a Percentage of GDP Comparison
The announcement of the purchase of $45 billion U.S. longer-term Treasury securities per month by the U.S. Federal Reserve bank indicates a continued expansion in central bank balance sheets. Combined with the previously announced $40 billion monthly purchases of Agency Mortgage-Backed Securities in September, approximately $85 billion U.S. longer-term securities will be purchased by the Fed every month. If this pace is continued, the Fed’s balance sheet will rise to $4.1 trillion, or 26.0% of U.S. GDP by the end of next year. Globally, the Fed still trails its peers among major advanced economies in terms of the central bank asset as a percentage of GDP.

Source: Bloomberg, Guggenheim Investments. Data as of 12/18/2012.
This article is distributed for informational purposes only and should not be considered as investing advice or a recommendation of any particular security, strategy or investment product. This article contains opinions of the author but not necessarily those of Guggenheim Partners or its subsidiaries. The author’s opinions are subject to change without notice. Forward looking statements, estimates, and certain information contained herein are based upon proprietary and non-proprietary research and other sources. Information contained herein has been obtained from sources believed to be reliable, but are not assured as to accuracy. No part of this article may be reproduced in any form, or referred to in any other publication, without express written permission of Guggenheim Partners, LLC. ©2012, Guggenheim Partners. Past performance is not indicative of future results. There is neither representation nor warranty as to the current accuracy of, nor liability for, decisions based on such information.
Copyright © Guggenheim Partners


