Upcoming US Events for Today:
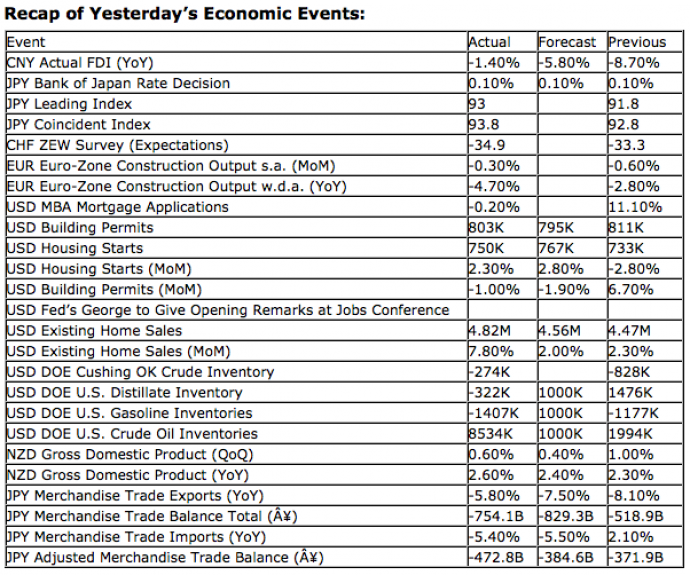
- Weekly Jobless Claims will be released at 8:30am. The market expects Initial Claims to show 373K versus 382K previous. Continuing Claims are expedted to reveal 3293K versus 3283K previous.
- The Philadelphia Fed Index for September will be released at 10:00am. The market expects –4.0 versus –7.1 previous.
- Leading Indicators for August will be released at 10:00am. The market expects no change (0.0%) versus an increase of 0.4% previous.
Upcoming International Events for Today:
- German Producer Price Index for August will be released at 2:00am EST. The market expects a year-over-year increase of 1.5% versus 0.9% previous.
- German PMI Manufacturing for September will be released at 3:30am. The market expects 45.2 versus 44.7 previous.
- Euro-Zone PMI Manufacturing for September will be released at 4:00am EST. The market expects 45.5 versus 45.1 previous.
- Great Britain Retail Sales for August will be released at 4:30am EST. The market expects a year-over-year increase of 3.2% versus 3.3% previous.
- Euro-Zone Consumer Confidence for September will be released at 10:00am EST. The market expects –24 versus –24.6 previous.
The Markets
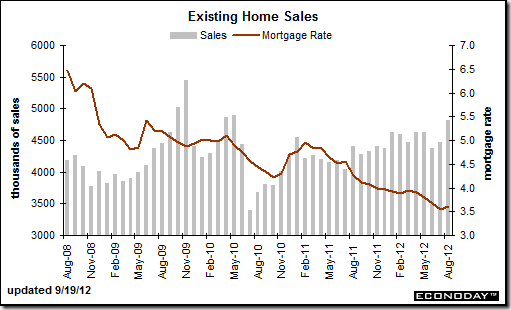
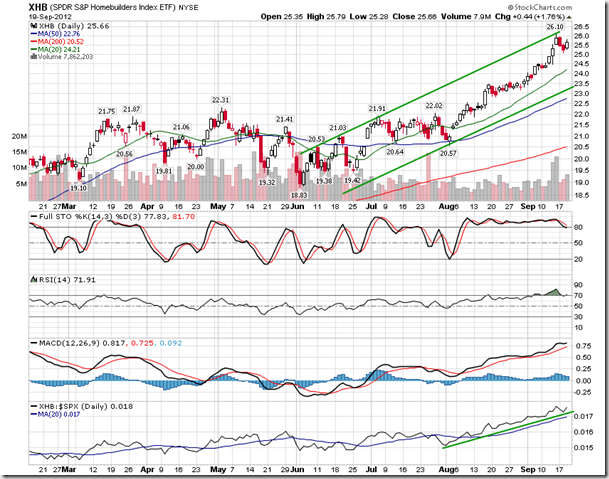
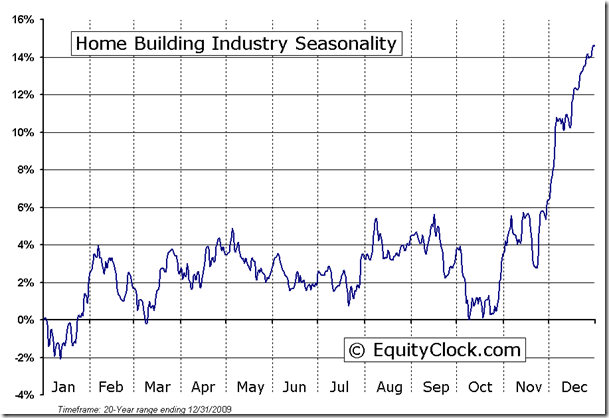
Markets traded marginally higher on Wednesday, driven primarily by Consumer Discretionary stocks following a much better than expected report on Existing Home Sales. Homebuilders such as Pulte, Lennar, and Toll Brother pushed strongly higher, attacking multi-year highs that have been established over the past few trading sessions. Increasingly the housing industry is showing signs of recovering with Existing Sales hitting the highest level since early 2010 and back to levels witnessed prior to the 2008/2009 recession. Housing starts are also holding around the highest levels since the recession began. Seasonal tendencies for the home building industry, however, are less than favorable over the next month or so as the summer selling season concludes. Following the month-long “swoon”, the stocks see their best seasonal gains during the fourth quarter of the year as investors begin anticipating the spring building season.
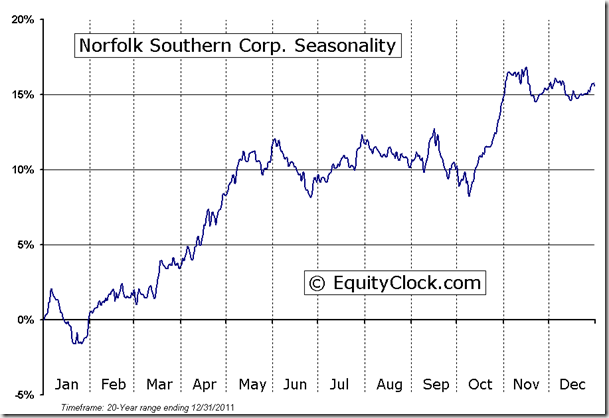
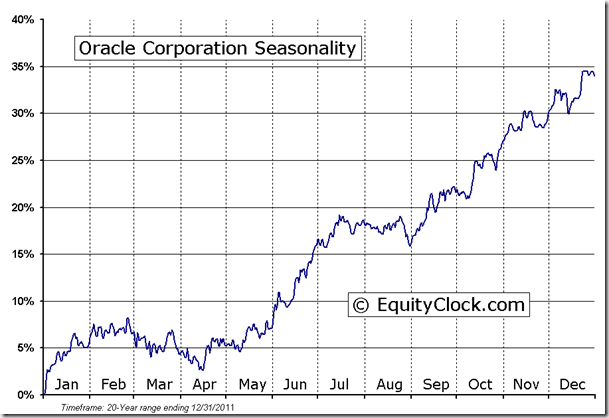
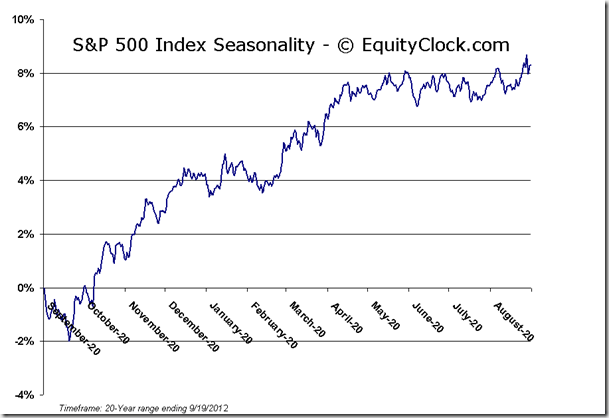
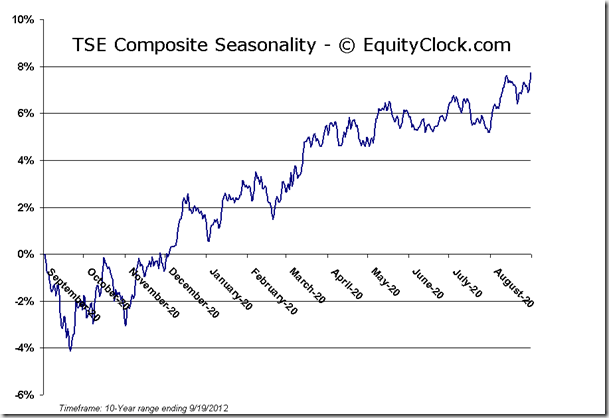
Over the past couple of days markets have seen momentum starting to show signs of decline. Price is stagnating. Seasonally, equity markets are within the weakest three week period of the year, which concludes just past the first week of October. Weakness has also been known to persist throughout October, resulting in an intermediate-term bottom that is often realized just prior to the end of the month. Given this seasonal framework and technicals for a number of asset classes starting to see momentum rolling over, probability is high that a selloff/correction will occur in the weeks ahead, potentially related to earnings caution. FedEx has been a recent prominent company touting weak economic fundamentals and earnings caution. Another transportation stock confirmed what FedEx was saying on Wednesday after the closing bell. Railroad operator Norfolk Southern warned that earnings would trail analyst estimates due to weakness in coal and merchandise shipments. An unrelated company, Adobe, also issued an earnings forecast on Wednesday that also missed analyst estimates. Oracle, a industry titan, will report earnings on Thursday after the market close, a report that is typically a leading indictor of the strength within the technology sector going into the seasonally favouable fourth quarter.
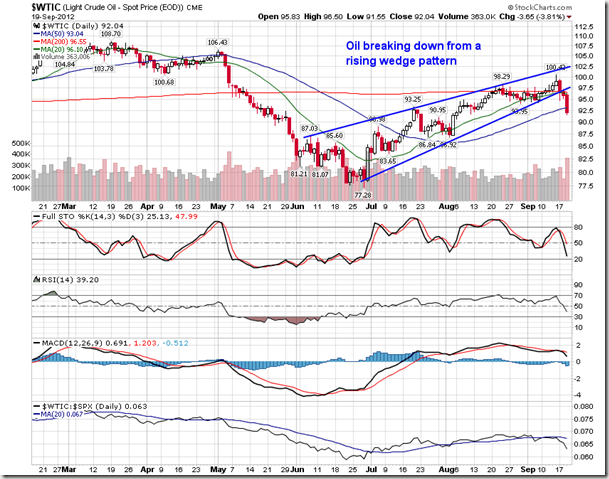
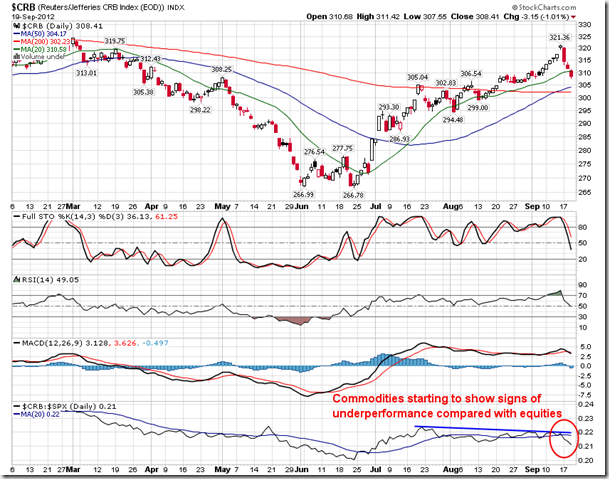
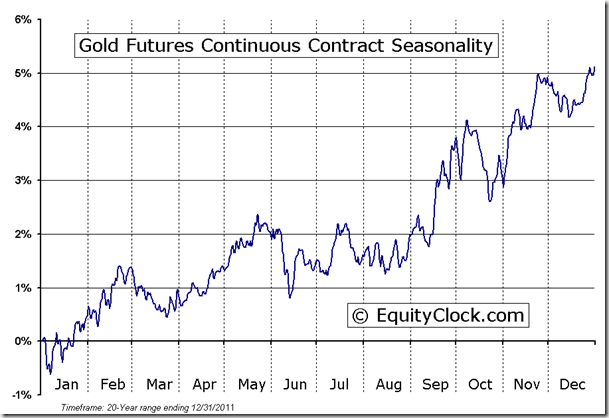
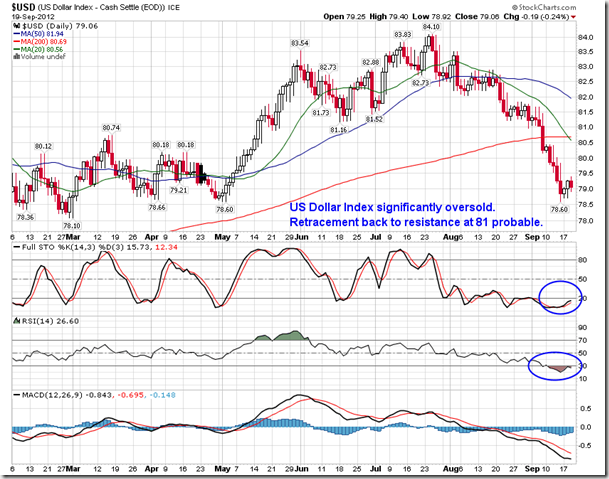
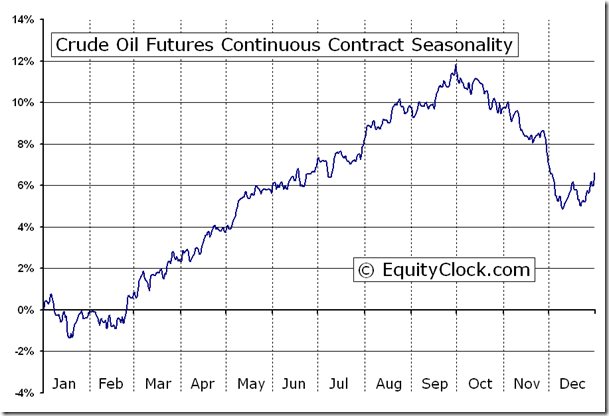
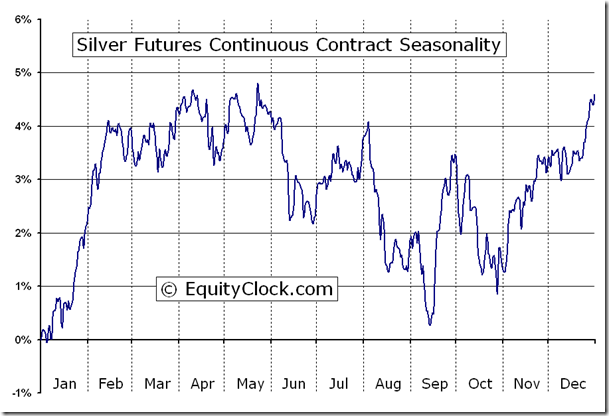
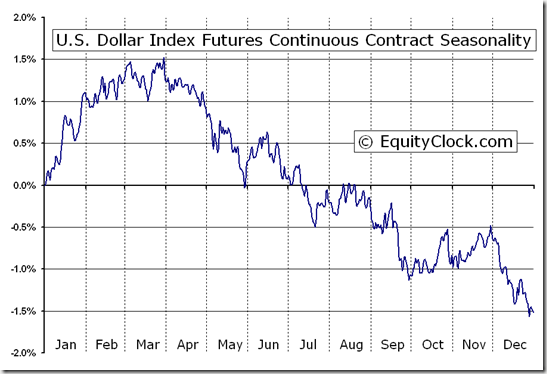
Weakness in equity markets over the next few weeks may be fueled by recent destabilization in commodity markets. The price of light crude oil has dropped from a recent high of just over $100 to $92 as of yesterday’s close, representing an 8% decline in just three sessions. A number of commodities have become stretched to the upside, trading into overbought territory after benefitting from recent declines in the US Dollar. The dollar in showing signs of rebounding from significantly oversold conditions. Commodities in general are due for some kind of pause/consolidation after recent runs higher. The CRB Commodity Index is already showing signs of declining relative performance compared with equities, typically a leading indicator to broad market weakness, in both commodities and equities. Positive seasonal tendencies for Oil conclude around this time of year and metals, such as Gold and Silver, have been know to weaken in the month of October. The US Dollar index also concludes seasonal declines at the end of September, seasonally trading flat over the course of October and November. We are nearing logical points for the commodity complex to correct and the recent breakdown in Oil may already be signaling that consolidation is already upon us. The price of Oil had been trading within a rising wedge ever since the June lows, a pattern that has now been broken to the downside, implying a retracement anywhere between present values and the summer lows is possible before the commodity moves higher.
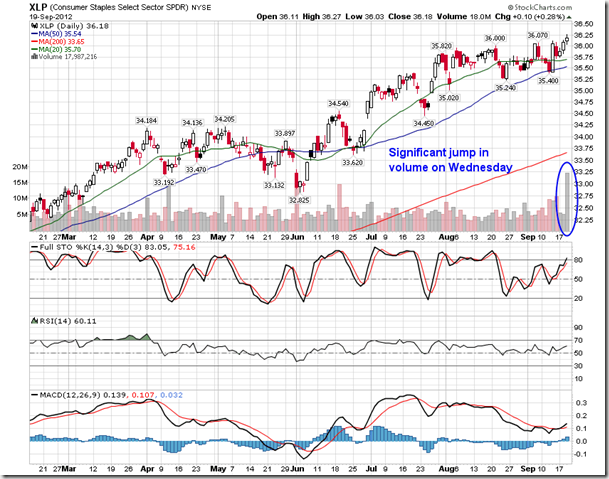
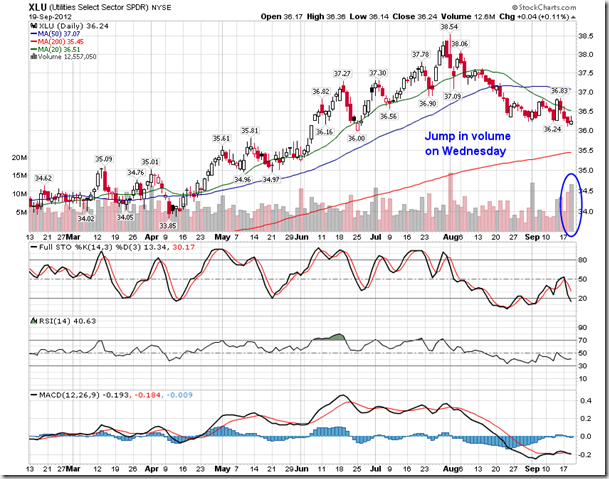
So with the increased probability of some kind of pullback in equity markets over the weeks ahead, particularly following futures and options expiration on Friday, investors are likely to take profits in various cyclical areas of the market and trade temporarily back into defensive areas in order to protect recent gains. On Wednesday, the Consumer Staple ETF and the Utilities ETF saw volumes ‘pop’, signaling renewed investor interest. Both Staples and Utilities can perform well relative to the market between now and the middle of October, making this an interesting place to hide should a multi-week correction take hold.
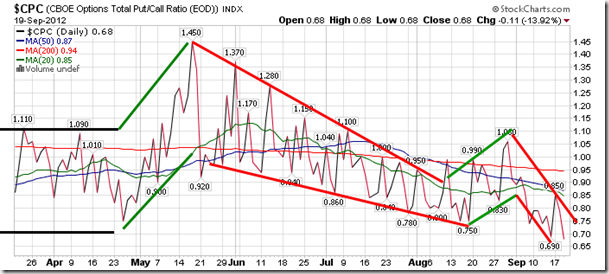
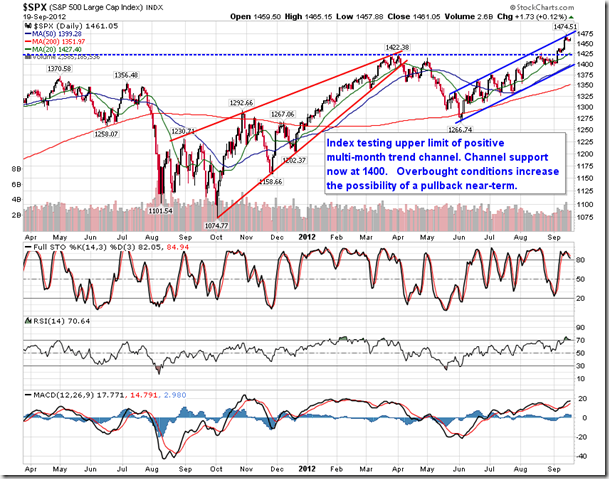
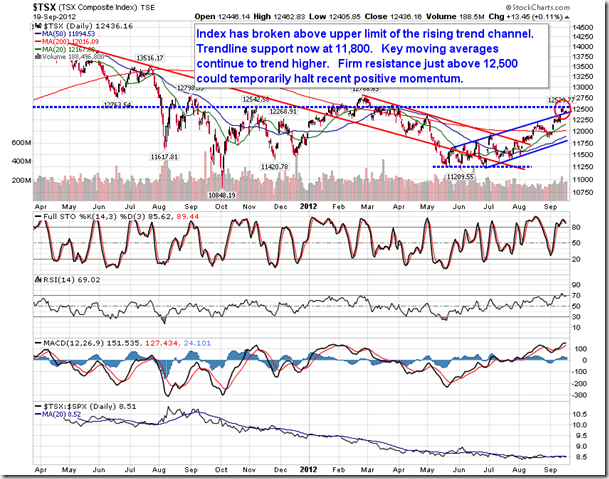
Sentiment on Wednesday, according to the put-call ratio, ended overly bullish at 0.68. Complacency is at an extreme. Not only is this the lowest ratio this year, but it is the lowest ratio since options and futures expiration week of July 2011, just prior to the significant plunge in the month of August. Extreme sentiment shifts, such as this, open up the possibility for shock events as investors drop negative bets and hedges. Any negative news events could pinch recent equity markets gains, perhaps initiating the multi-week correction that seasonal tendencies suggest. Any weakness that is realized in the weeks to come is likely to be in-line with the intermediate positive trend, meaning that losses beyond the lower limit of the almost four month old trend channel on the S&P 500 Index is probably unreasonable unless a significant negative catalyst becomes known. The chart for the S&P 500 Index is shown below.
Chart Courtesy of StockCharts.com
Chart Courtesy of StockCharts.com
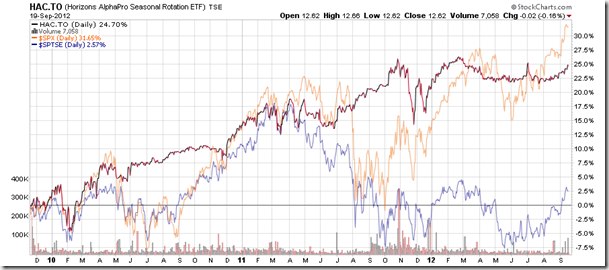
Horizons Seasonal Rotation ETF (TSX:HAC)
- Closing Market Value: $12.62 (down 0.16%)
- Closing NAV/Unit: $12.64 (up 0.23%)
Performance*
| 2012 Year-to-Date | Since Inception (Nov 19, 2009) | |
| HAC.TO | 3.81% | 26.4% |
* performance calculated on Closing NAV/Unit as provided by custodian
Click Here to learn more about the proprietary, seasonal rotation investment strategy developed by research analysts Don Vialoux, Brooke Thackray, and Jon Vialoux.


