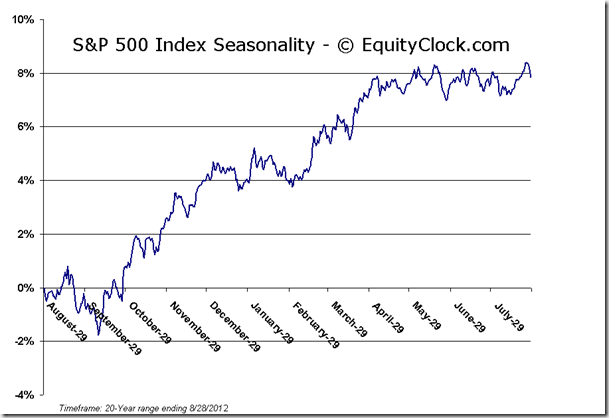
Seasonality, Odds for 'Easing Disappointment' Warrant Caution in Broader Markets
by Don Vialoux, EquityClock.com
Upcoming US Events for Today:
- Q2 GDP Estimate will be released at 8:30am. The market expects an increase of 1.7% versus an increase of 1.5% previous.
- Pending Home Sales for July will be released at 10:00am. The market expects an increase of 1.0% versus a decline of 1.4% previous.
- Weekly Crude Inventories will be released at 10:30am.
- The Fed’s Beige Book for August will be released at 2:00pm.
Upcoming International Events for Today:
- German Consumer Price Index for August will be released at 8:00am EST. The market expects a year-over-year increase of 1.9% versus 1.7% previous.
- Japanese Retail Sales fro July will be released at 7:50pm EST. The market expects a year-over-year decline of 0.3% versus an increase of 0.2% previous.
The Markets
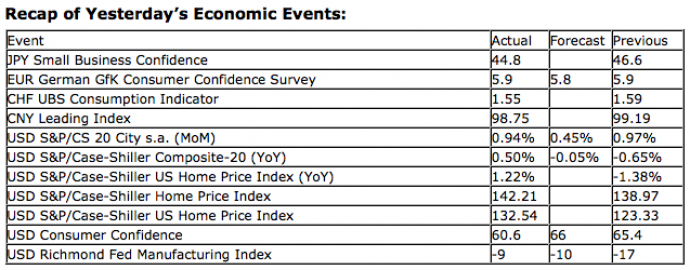
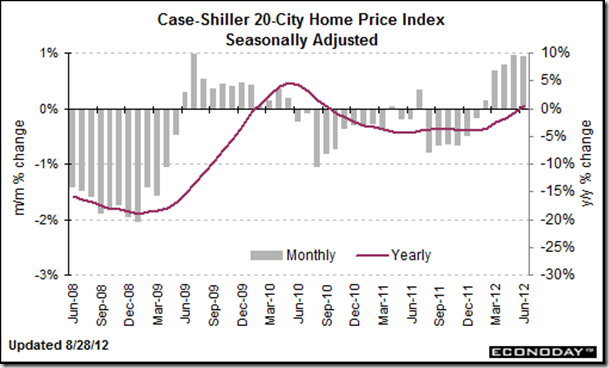
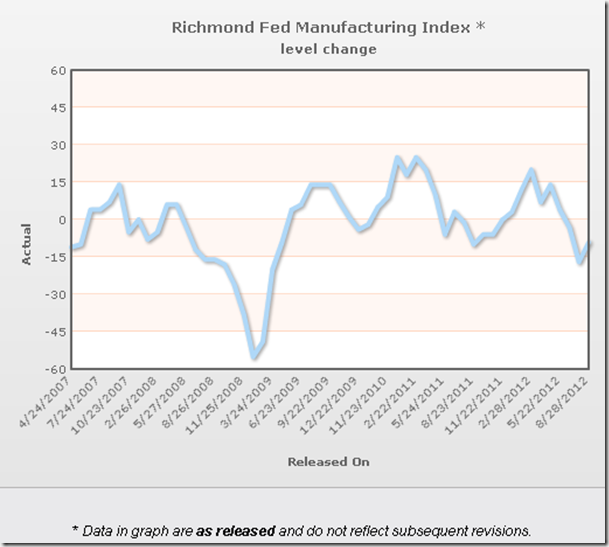
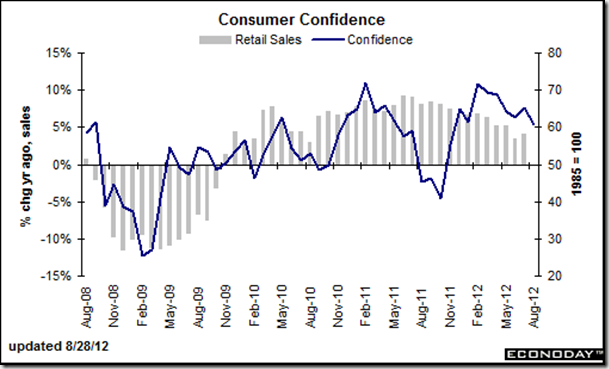
Markets traded flat on Tuesday as investors held the tape steady ahead of Ben Bernanke’s speech in Jackson Hole at the end of this week. Economic news was mixed with the Case Shiller Home Price Index and the Richmond Fed Manufacturing Index both beating expectations, while Consumer Confidence showed a significant miss. The Case Shiller report showed a year-over-year gain of 0.5% for the month of June, beating estimates of 0.0%, in a sign that the housing market continues to improve. The Richmond Fed received a boost from last months low of –17 to report a –9, still in contractionary mode but better than the analyst estimate of –10. And perhaps the most important indicator given the time of year is Consumer Confidence, which reported a 9-month low of 60.6, well below estimates of 65.8. Consumer confidence has been trending lower since last Christmas and it is not a very optimistic sign that the lows of the year are becoming realized as we enter the period of seasonal strength for retail, with back-to-school, Thanksgiving, and Christmas spending expected to give the economy a boost. Retail is a key driver of the economy in the last few months of the year and if consumers are not confident, they may not spend. Here is what Econoday.com had to say regarding this report:
Weakness in today’s report is centered in the assessment of future conditions where components make up 60 percent of the composite index. The three components all show deterioration especially in the degree of pessimism on future business conditions, employment, and income. Pessimism for these readings, particularly income, poses an early warning for retailers as they prepare for the holiday shopping season.
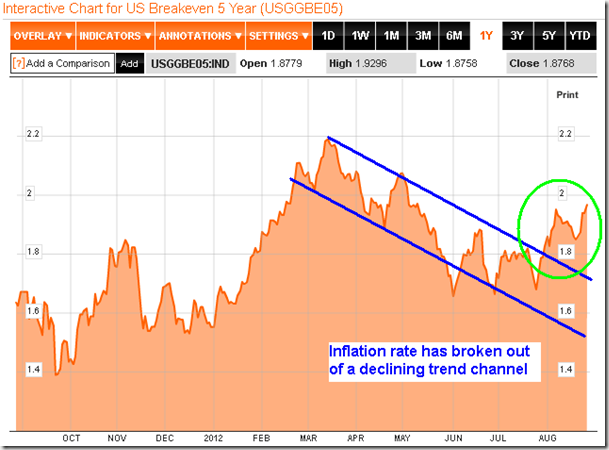
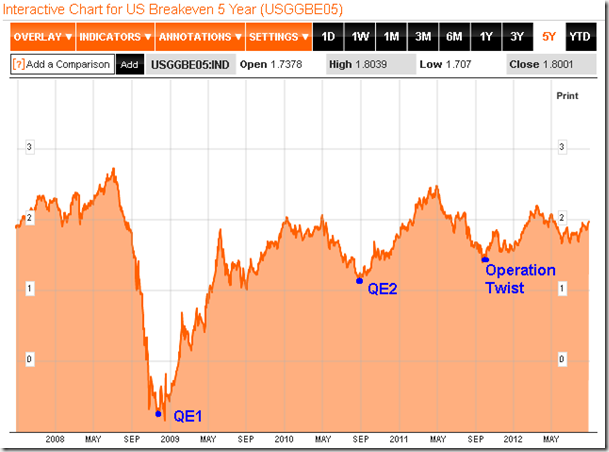
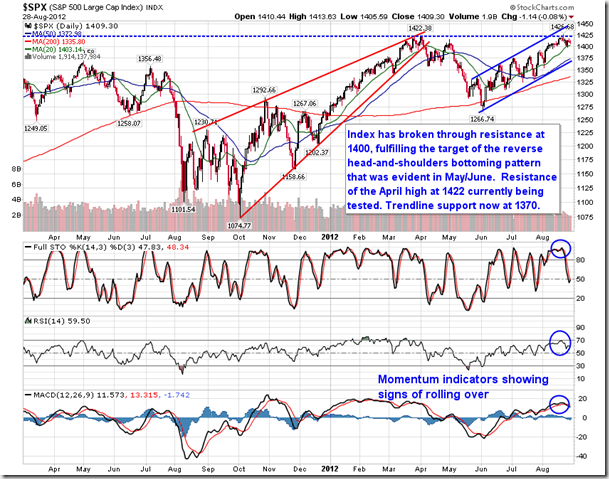
So analysts for the past week have been providing their guess as to what Ben Bernanke will reveal in this week’s speech and more importantly, what will the Fed and the ECB will offer at their upcoming meetings: Will additional monetary stimulus be offered as is widely anticipated? Additional stimulus seems to be a foregone conclusion by the market and many analysts expect that something will be offered, perhaps in the coming days. Unfortunately, the chances of further monetary stimulus at this point in time are very low for one reason: rates. It is commonly known that the Fed follows the 5-year breakeven rate, which gauges the level of inflation in the economy. Back at the last FOMC meeting at the end of July, the rate of inflation was essentially within a downward trend channel, suggesting disinflation. In order to correct the trend, further accommodation appeared appropriate, which is what the Fed’s notes indicated. However, since the meeting, the rate of inflation has broken out of this 5-month declining trend and has now moved closer to 2% (1.98% as of Tuesday’s close). Back in January the Fed set an inflation target of 2%, noting that an inflation rate of 2 percent is best aligned with its congressionally mandated goals of price stability and full employment. Looking at the 5-year chart and the points where previous quantitative easing programs were initiated, you can clearly see that the additional easing was offered when inflation was significantly low (or negative as in the case of the end of 2008). With Inflation seemingly stabilizing over the past year around the informal target range of roughly 1.7 percent to 2 percent under the current Operation Twist program, it is probably unreasonable for the Fed to act further at this time in order to push the limit.
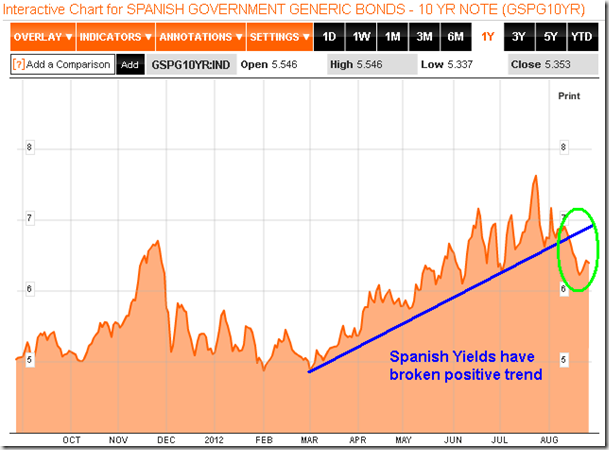
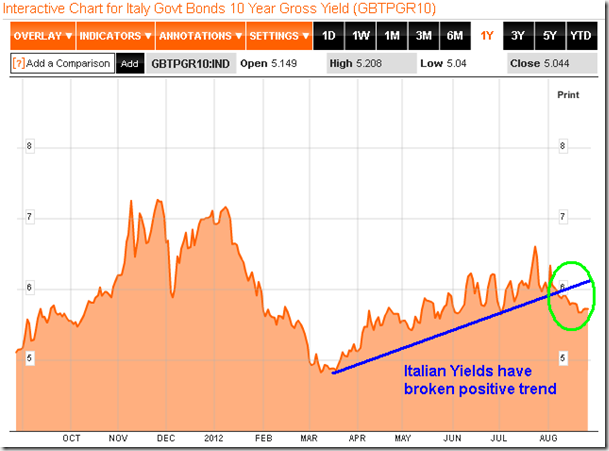
But let’s not forget that the ECB is also expected to act. Back at their last meeting, yields on Spanish an Italian debt were in a firm uptrend, posing a significant threat to destabilization in the Euro zone and prompting the ECB President to stand behind the struggling currency. Since those comments, yields have broken a 5-month rising trend, bringing calm to the area. And lets not forget that the next ECB meeting (September 6) happens before the German court ruling on the constitutionality of the ESM (September 12), potentially constraining European Central Bank officials until the judgment is received. With markets at resistance and expectations of further easing likely to prove unrealistic, the chance of a market selloff based upon disappointment is greater than the chance of a market surge higher based on additional stimulus. Keep in mind that anything is still possible as central banks can be known to surprise, but the probability favours a disappointment, which puts the market at risk of a shock event given the complacency that is prevalent within equities. Caution is prudent.
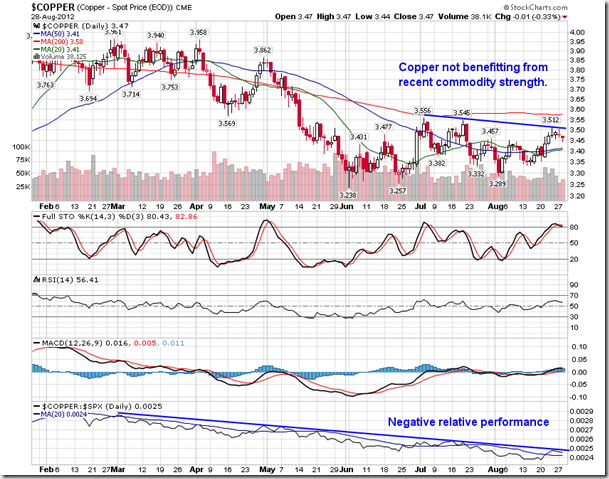
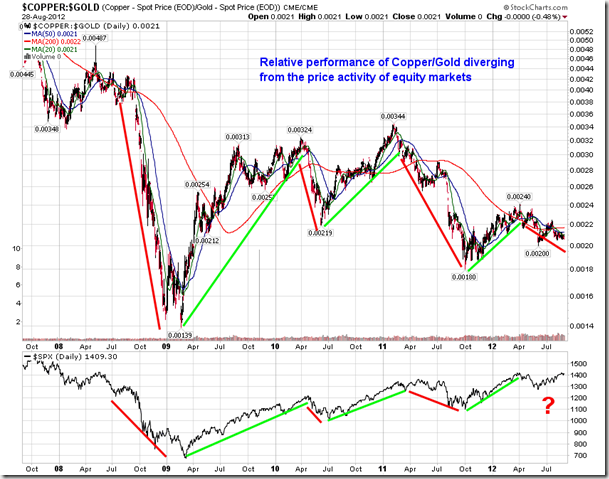
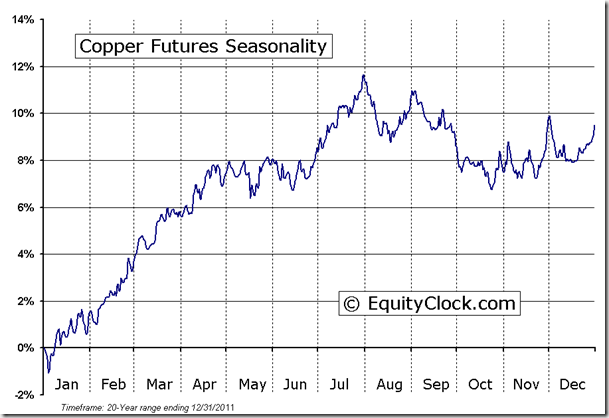
Now, on to today’s warning signal. In each of the reports this week we have indentified reasons to be cautious due technical indicators diverging from the recent market strength. Today we focus on copper. Commodities have no doubt been strong recently, helped by a weaker US dollar. This has allowed breakouts to be realized in Gold, Platinum, and Silver. Energy commodities remain on a positive trend, holding near the highs of the summer. And agricultural commodities certainly have a bid to them with drought conditions fueling speculation of supply disruptions. However, as all of these commodities hover around the highs of the summer/quarter, copper has failed to participate. The commodity has been unable to break through the highs set at the beginning of July as it holds within an underperforming trend that began in February. Copper is often referred to as Dr. Copper due to its ability to predict market strength as a result of the cyclical nature of the commodity. Copper has also underperformed gold since April, just as equity markets were peaking. In fact, the relative performance of Copper (the risk-on trade) and Gold (the risk-off trade) has been very indicative of equity market strength. Copper bottomed relative to Gold in October of 2011, moving higher through to April 2012, just as the equity market peaked. Similarly, copper bottomed relative to gold in the summer of 2010, just before the Fed induced stimulus rally that lasted through to early 2011. The relative performance then declined through Q2 and Q3 of 2011, almost forecasting the negative move to come for equities from July through October. Results are similar in past occurrences as well. The recent divergence between Copper relative to Gold and equities suggests that risk aversion continues to persist, a bearish setup that could lead to market declines. The period of seasonal strength for copper runs from December all the way through to July as manufacturing activity picks up in the first half of the year.
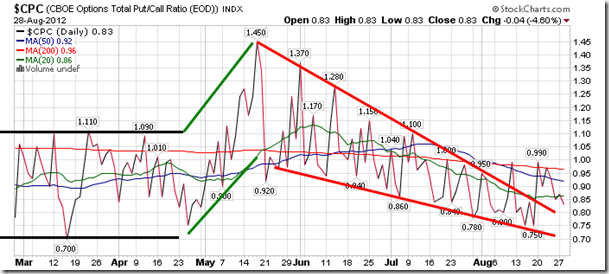
Sentiment on Tuesday, as gauged by the put-call ratio, ended bullish at 0.83.
Chart Courtesy of StockCharts.com
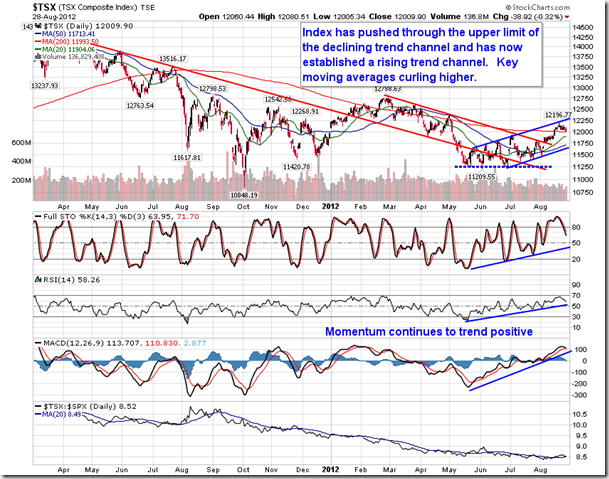
Chart Courtesy of StockCharts.com
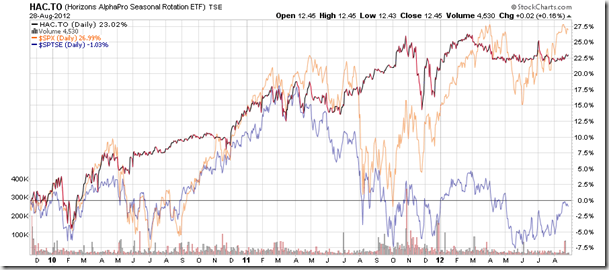
Horizons Seasonal Rotation ETF (TSX:HAC)
- Closing Market Value: $12.45 (up 0.16%)
- Closing NAV/Unit: $12.44 (down 0.04%)
Performance*
| 2012 Year-to-Date | Since Inception (Nov 19, 2009) | |
| HAC.TO | 2.15% | 24.4% |
* performance calculated on Closing NAV/Unit as provided by custodian
Click Here to learn more about the proprietary, seasonal rotation investment strategy developed by research analysts Don Vialoux, Brooke Thackray, and Jon Vialoux.
Copyright © EquityClock.com


