by Donald Vialoux, Tech Talk
Interesting Chart
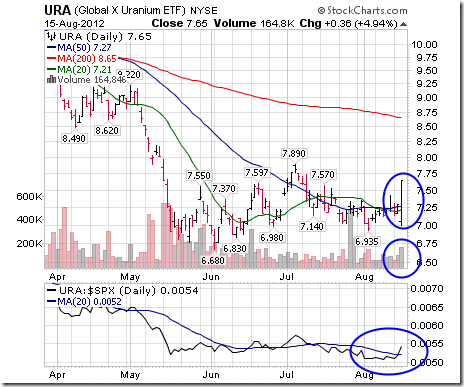
The uranium ETF came alive yesterday. Nice break to the upside on higher volume, a move above its 20 and 50 day moving average as well as early signs of outperformance.
Mark Leibovit’s Recommended List Changes
Bulletin
Adding UEC and NLR (both uranium plays) to the recommended list at the market. I know we’re weighted heavily in uranium, but I’m looking for some further diversification. We already own URRE, USU and DNN.
Stop 1.75. Target 3.75 in UEC.
Stop 13.00. Target 18.00 in NLR.
Gold Seasonality
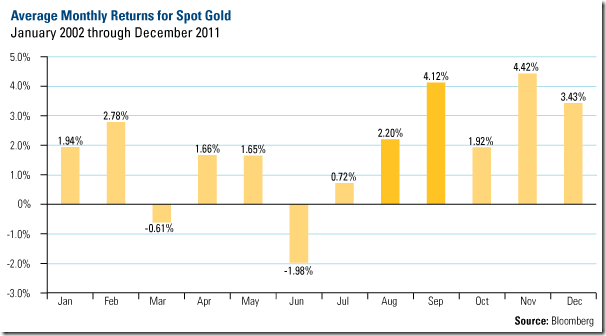
“So while gold has its monthly ups and downs, you can see that, on a historical basis, we have arrived at gold’s peak performance period of the year. Based on 10 years of data, gold bullion has historically increased 2 percent in August and 4 percent in September.”
– Frank Holmes
Source: BullionBuzzeNewsletter
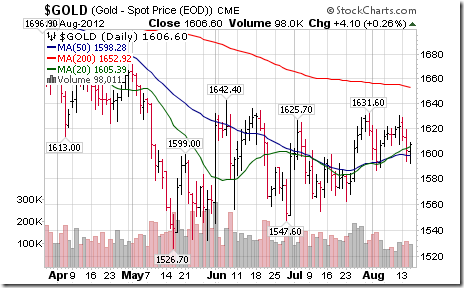
Yesterday, Gold moved above its 20 and 50 day moving averages.
Adrienne Toghraie’s “Trader’s Coach” Column
More Isn’t Always BetterFor Traders
By Adrienne Toghraie, Trader’s Success Coach
While it is important to have a good education in trading, you must know when to stop and execute what you have learned. Education junkies will not become the best traders unless they have already proven themselves to be successful at being a trader before adding additional information to their memory bank.
Education junkie Ray
Ray is a highly educated man in several professional fields. As a scientist, where he has mainly focused his attention, addictively gathering information has been a good strategy for success in his field.
When Ray was introduced to trading, he decided to read every book that was recommended by professional traders he encountered at trade shows and other events. Four years into his studies he still has not been able to develop a clearly defined strategy. The reasons are:
· He is trying to come up with the perfect system
· The information he has learned very often is in conflict
· If he uses all of the filters that are recommended, he will never find a decent opportunity
· He is afraid of being wrong
· He is afraid of loss
· Loss for him is an indication that he needs more information
· Knowledge itself has become an addictionWhen I met Ray at an Expo, I asked him if he wanted to be a trader who earned money, or if he wanted to be a trading academic? He, of course, said that he wanted to be a trader. When I suggested to him that he put down the books and come up with a strategy, he found it impossible. This is when he called me to invest in coaching.
On the first day of our coaching, which was mostly dedicated to gathering information on how he thinks, he said, “What will I do with my evenings if I can’t read my books?” I handed him a short mystery novel. This started a debate and ended with him wanting to prove to me that he was not addicted. Of course, I knew that he would not be able to read the novel. This was another wake up call for Ray.
Ray was also addicted to energy deprivation. He trained his neurology to adapt to living life with a high level of stress and little sleep. In other words, he was borrowing energy from his future, and he was almost bankrupt. His addictive behavior of cluttering his mind with more information added to his stress. When he stopped pushing, all he wanted to do was sleep. He was so sleep deprived it was not easy to keep him awake during our second day session.
Ray had to learn how to simplify, plan, de-stress and be willing to study in an area other than trading.
Other areas of trading where you might be doing too much
If traders can be honest with themselves, they may find out that their over-kill behaviors are the reason that they are not earning profits from trading. Here are some to consider:
· Too many systems or strategies
· Too many indicators
· Too many time frames
· Too many commodities
· Too much time spent on trading in a day/week
· Too much listening to the advice of others
· Too much environmental stress
Conclusion
There are many reasons you might not be making profits in trading. Consider the possibility that perhaps you are doing too much in one or more areas of trading.
New Free Monthly Newsletter
More Articles by Adrienne Toghraie, Trader’s Success Coach
Sign Up at – www.TradingOnTarget.com
Don Vialoux on BNN Television Yesterday
Following are links to the interview:
http://watch.bnn.ca/#clip740726
http://watch.bnn.ca/#clip740727
http://watch.bnn.ca/#clip740729
http://watch.bnn.ca/#clip740733
http://watch.bnn.ca/#clip740735
http://watch.bnn.ca/#clip740736
http://watch.bnn.ca/#clip740740
http://watch.bnn.ca/#clip740744
Weekly SPDR Select Sector Review
Technology
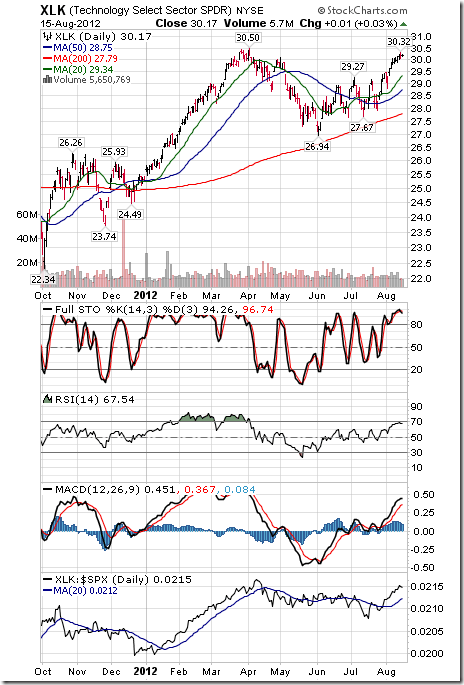
· Intermediate trend is up.
· Units remain above their 20, 50 and 200 day moving averages.
· Short term momentum indicators are overbought, but have yet to show signs of peaking.
· Strength relative to the S&P 500 Index remains positive.
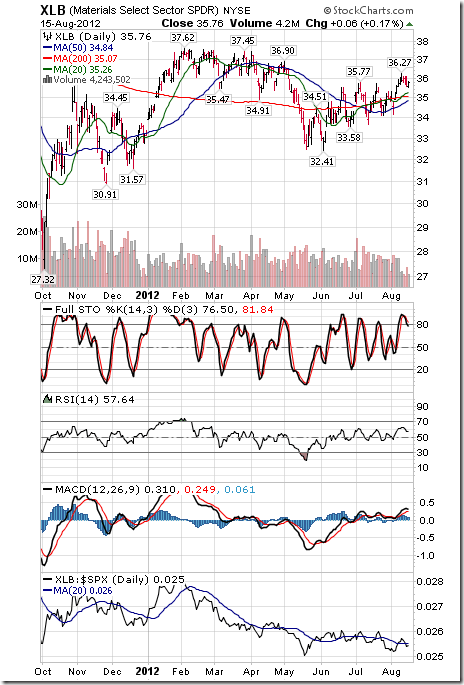
Materials
· Intermediate trend is up.
· Units trade above their 20, 50 and 200 day moving averages.
· Short term momentum indicators are overbought, but have yet to show signs of peaking.
· Strength relative to the S&P 500 Index remains neutral.
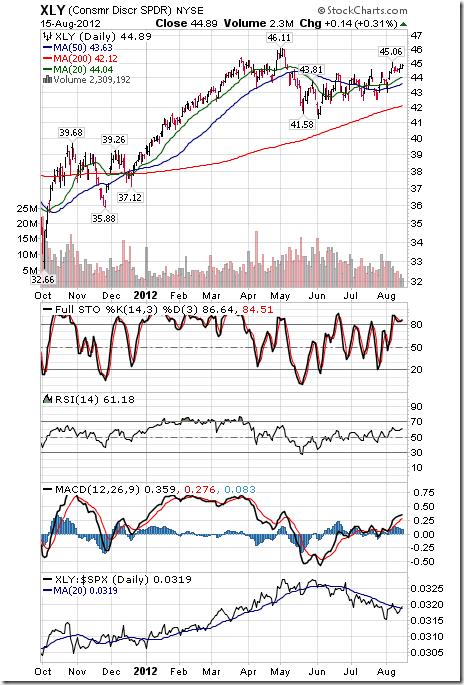
Consumer Discretionary
· Intermediate trend is neutral. Support is at $41.58 and resistance is at $46.11
· Trades above its 20, 50 and 200 day moving averages
· Short term momentum indicators are overbought, but have yet to show signs of peaking.
· Strength relative to the S&P 500 Index remains negative.
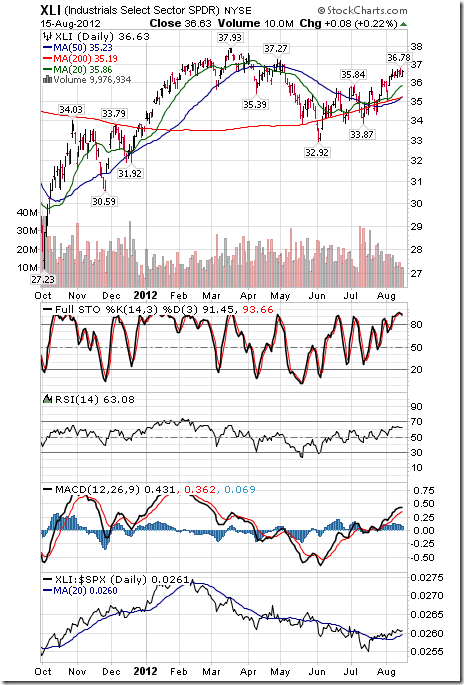
Industrials
· Intermediate trend is up.
· Trades above its 20, 50 and 200 day moving averages.
· Short term momentum indicators are overbought, but have yet to show signs of peaking.
· Strength relative to the S&P 500 Index remains positive.
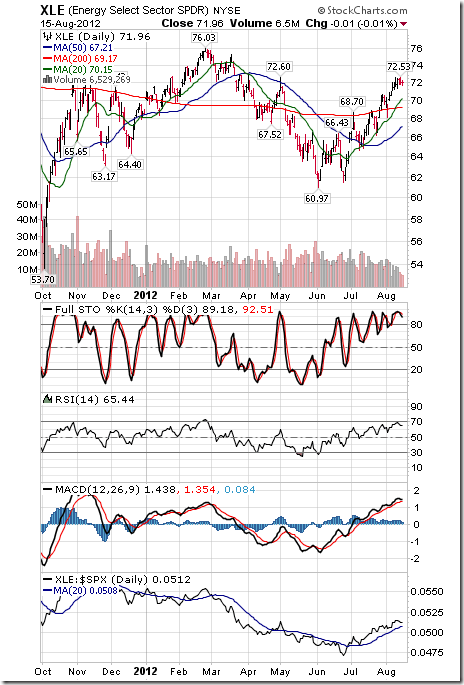
Energy
· Intermediate trend is up.
· Trades above its 20, 50 and 200 day moving averages.
· Short term momentum indicators are overbought, but have yet to show signs of peaking.
· Strength relative to the S&P 500 Index remains positive.
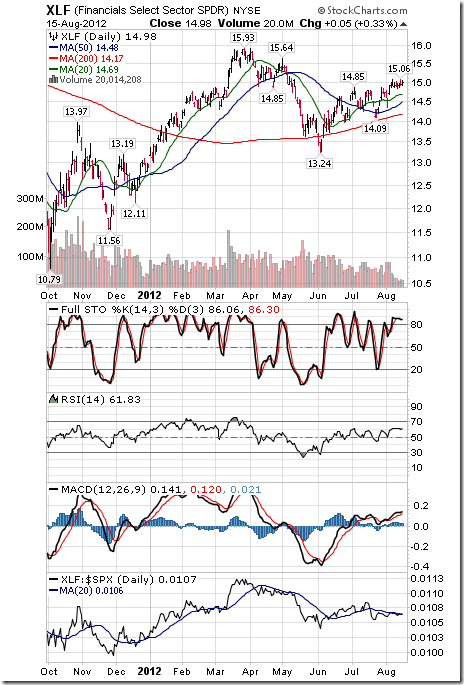
Financials
· Intermediate trend is up.
· Trades above its 20, 50 and 200 day moving averages.
· Short term momentum indicators are overbought, but have yet to show signs of peaking.
· Strength relative to the S&P 500 Index remains neutral.
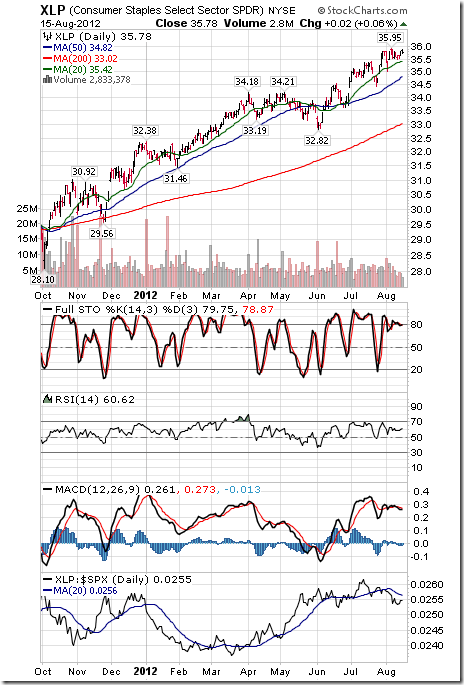
Consumer Staples
· Intermediate trend is up.
· Trades above its 20, 50 and 200 day moving averages.
· Short term momentum indicators are overbought and showing signs of rolling over.
· Strength relative to the S&P 500 Index remains negative.
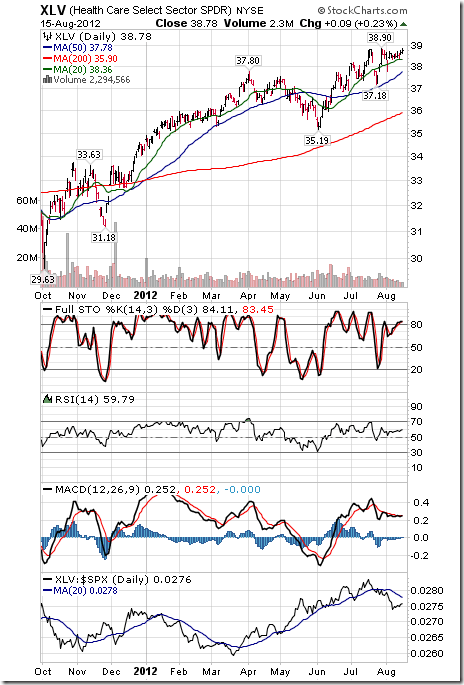
Health Care
· Intermediate trend is up.
· Trades above its 20, 50 and 200 day moving averages.
· Short term momentum indicators are overbought and showing early signs of rolling over.
· Strength relative to the S&P 500 Index remains negative.
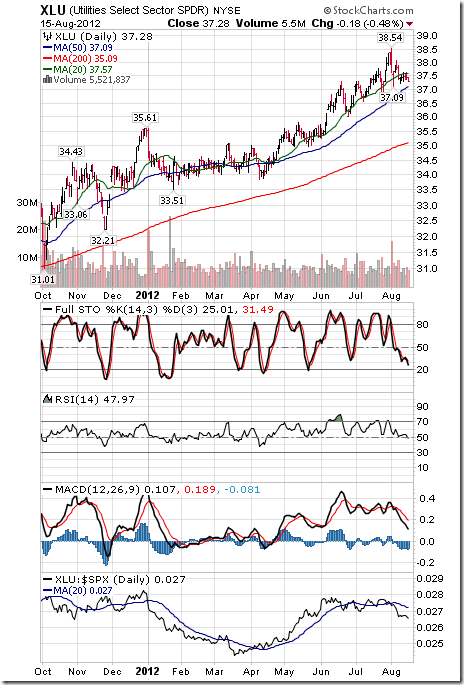
Utilities
· Intermediate trend is up
· Trades above its 50 and 200 day moving averages and below its 20 day moving average.
· Short term momentum indicators are trending down.
· Strength relative to the S&P 500 Index remains negative.
Special Free Services available through www.equityclock.com
Equityclock.com is offering free access to a data base showing seasonal studies on individual stocks and sectors. The data base holds seasonality studies on over 1000 big and moderate cap securities and indices.
To login, simply go to http://www.equityclock.com/charts/
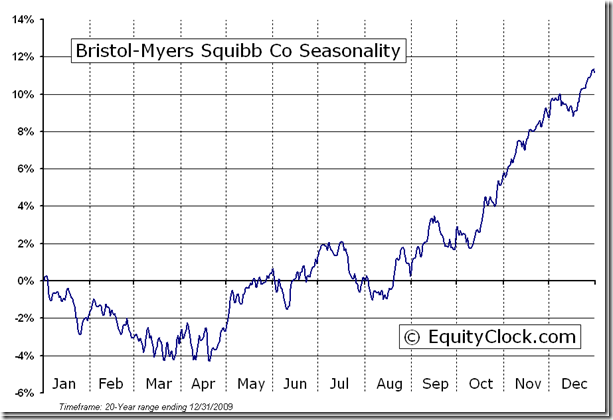
Following is an example:
Bristol Myers Squibb Co. (NYSE:BMY) Seasonal Chart
Disclaimer: Comments and opinions offered in this report at www.timingthemarket.ca are for information only. They should not be considered as advice to purchase or to sell mentioned securities. Data offered in this report is believed to be accurate, but is not guaranteed.
Don and Jon Vialoux are research analysts for Horizons Investment Management Inc. All of the views expressed herein are the personal views of the authors and are not necessarily the views of Horizons Investment Management Inc., although any of the recommendations found herein may be reflected in positions or transactions in the various client portfolios managed by Horizons Investment Management Inc
Horizons Seasonal Rotation ETF HAC August 15th 2012


