


by Brent Olson and Tom Ross, Janus Henderson
What goes up must come down. This Newtonian truism about the gravitational pull on objects is often applied to financial markets. After an extended period of markets moving higher, people assume they will fall. It is here that the gravitational link breaks down, because after a period of markets declining, people assume they will rise. Markets often seem to chase an elusive mean. We see this argument taking place in the world of credit spreads on high yield corporate bonds and corporate bonds more generally. As a reminder, the credit spread is the difference in yield between a corporate bond and a corresponding government bond of similar maturity. It is essentially the compensation that the market is demanding for taking on the risk of investing in the corporate bond.
“Spreads are tight”, goes the refrain “so they have to widen”. Well, like the proverbial stopped watch, it will be true eventually. With high yield spreads in the tightest 5% of readings over the past 25 years, the laws of probability mean they can widen more than they can shrink.1 But quite often spreads can linger in a range for long periods of time. This is evident in Figure 1, which shows high yield spreads over the last 25 years.
Figure 1: High yield spreads can be rangebound for some time (basis points)
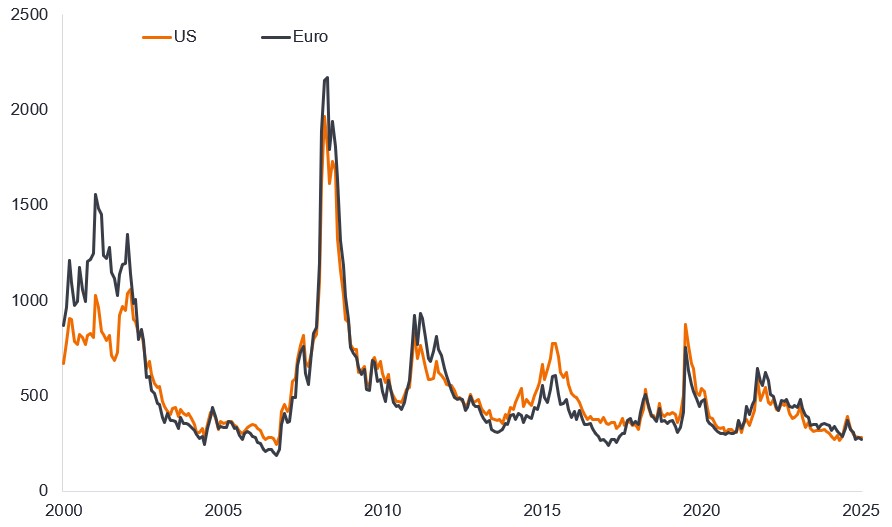
Source: Bloomberg, ICE BofA US High Yield Index, ICE BofA Euro High Yield Index, spread shown is Govt option-adjusted spread (OAS), 30 September 2000 to 30 September 2025. One basis point equals 1/100 of a percentage point. 1 bp = 0.01%, 100 bps = 1%. Past performance does not predict future returns.
What is noticeable about the chart above is that spreads need a catalyst to gap wider meaningfully. You can see the 2001 dotcom bubble, the 2008 Global Financial Crisis, the 2012 Eurozone debt crisis/taper tantrum, the 2015 energy crisis, the 2020 Covid pandemic, and the 2022 inflationary surge that provoked a rapid reset higher in interest rates. Ironically, all the alarm generated around Liberation Day tariffs registers as little more than a blip on the chart.
Could we be in a period like the mid-2000s or the late 2010s where spreads hover around low levels? There are several reasons why we believe spreads could stay relatively tight.
1. The global economy is in reasonable shape
There might still be a lagged effect to tariffs but so far the global economy is holding up. Weaker US non-farm payrolls figures might be explained by changing dynamics in the US labour market from tighter immigration controls. The economy may be creating fewer jobs but there is scant evidence of a pick-up in layoffs, with weekly initial jobless claims remaining rangebound.2
In fact, if we look at high frequency data – the type of data reported on a daily or weekly basis that provides a snapshot of the economy right now – this remains buoyant. The US Weekly Economic Index compiled for the Federal Reserve Bank of Dallas, which uses ten such components, has, if anything, been strengthening since a summer lull. The index is scaled to four-quarter US gross domestic product growth in percent to provide an indicator of how strong the economy is growing. With tax cuts potentially saving the average American taxpayer $3,700 in 2026, and favourable tax treatment on depreciation of business investment, the stage may be set for the economy to grow stronger still as fiscal stimulus comes through.3
Figure 2: Weekly Economic Index, 2019-present (%)
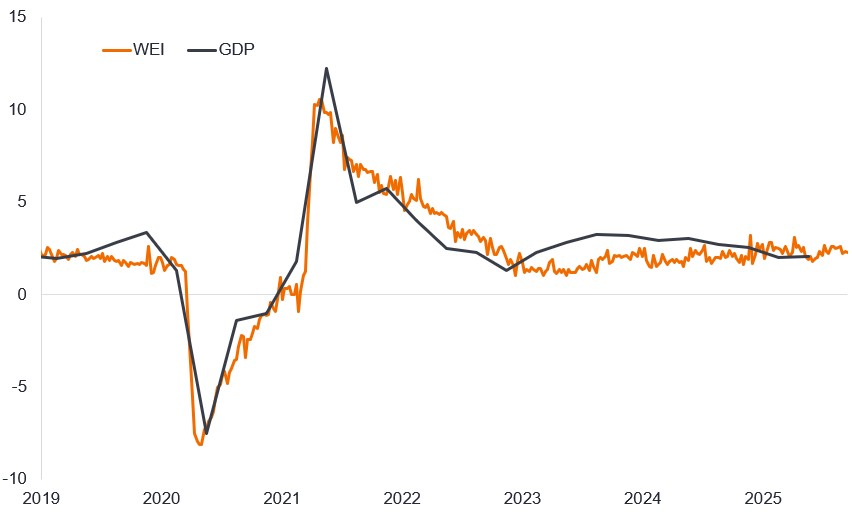
Source: LSEG Datastream, Weekly Economic Index, annual real gross domestic product (GDP) growth (four-quarter moving average based on GDP releases from the Bureau of Economic Analysis). Lewis, Daniel J., Mertens, Karel, and Stock, James H., Weekly Economic Index, https://dallasfed.org/researcg/wei.
It is a similar picture in Europe. The HCOB Flash Eurozone Composite PMI Output Index climbed to 51.2, which is a 16-month high.4 This index compiles results from surveys of purchasing managers across both services and manufacturing, with any figure above 50 indicating expansion. With German infrastructure spend and wider European defence spending set to pick up pace, this should additionally offer support to the economy.
Given this backdrop, earnings have been strong. In the US, with most companies having reported their Q2 2025 earnings, profits were up 13.4% for the large cap S&P 500 compared with the same quarter back in 2024. For the Russell 2000 Index of smaller companies, earnings over the same period were up an astonishing 67%, driven by technology, healthcare and financials, with energy a drag. In Europe, earnings growth was less dramatic, but still up 3.9% year-on-year for Q2 for the STOXX 600.5
Earnings resilience means that gross leverage levels (total debt divided by earnings) are around 3.7x earnings for both US and Euro high yield, which is below average for the last 10 years.6
2. Rate cuts should be supportive for high yield
Strong corporate fundamentals and a steepening yield curve environment are potentially a good mix for high yield. High yield bonds are typically issued with shorter maturities (less than five years) so the yields tend to respond to what happens at the shorter end of the yield curve.
With the US Federal Reserve (Fed) indicating it is on a rate cutting trajectory, fixed yields become relatively more valuable and floating rate assets less attractive. Spreads may be tight, but if corporate conditions remain robust and interest rates on cash and yields on shorter-dated government bonds are falling then it becomes easier to reconcile why the market is chasing the higher yield from high yield bonds and is prepared to accept greater credit risk. An extra 2.5% to 3% of yield (provided you can avoid defaults) above government bonds has its attractions.
Furthermore, we are at an interesting alignment in markets. Sovereign bond yields are relatively high compared to where they have been over the past 15 years. This means more of the yield on a high yield bond is made up of the sovereign bond component. Additionally, the Fed’s reaction function (its desire to react to bad economic news) is more favourable. If we get weaker economic data (such as disappointing jobs figures) then that is likely to lead to rate cuts and lower Treasury yields. In such an environment, credit spreads might widen but the negative price effect could be cushioned by Treasury yields falling, so high yield investors might be no worse off and still get to receive the yield (assuming no default) on the bond.
3. Relative scarcity is an attraction for high yield
A big support for high yield is market technicals (supply and demand). The world is awash with government bond issuance, but there are simply not that many companies issuing in the high yield corporate bond market. With investors seeking yield, flows into the asset class are strong, further supported by reinvestment flows from coupons and maturing principals from existing high yield bonds. This helps explain the tightness of spreads as many bond issues are oversubscribed. September is usually the biggest month of the calendar year for issuance and September 2025 was actually the third strongest month recorded for US high yield bond issuance ($57 billion)7, yet spreads tightened, giving an indication of the level of demand.
4. Ratings changes mean spreads may not be all that tight
High yield indices are, on average, better quality than in previous credit cycles, i.e. the index today has a higher proportion of BB rated bonds and fewer of the lower quality CCC rated bonds, so it is somewhat unfair to compare with spread tights of the past.
Morgan Stanley looked at the US high yield market and adjusted for ratings mix and price (a large number of bonds today trade below par and so would enjoy a pull to par as they get closer to maturity) and surmised that were the index shaped as it was in mid-2025, previous tights would be lower across the board. At 30 September 2025, the average spread on the US high yield bond market was 280bps, so still well above the lows experienced in the 1990s and mid-2010s.
Figure 3: Current tights feel less tight after adjusting for index changes
| Oct 1997 | Mar 2025 | Jun 2007 | Jun 2014 | Oct 2018 | Jan 2020 | Jun 2021 | Jul 2025 | |
|---|---|---|---|---|---|---|---|---|
| Index OAS (bp) | 245 | 271 | 241 | 336 | 316 | 340 | 300 | 287 |
| % Secured | 13% | 13% | 12% | 20% | 17% | 18% | 23% | 35% |
| Price | 103 | 105 | 102 | 107 | 99 | 103 | 106 | 98 |
| Adjustments (bp) | ||||||||
| Ratings mix | -6 | -28 | -20 | -26 | -16 | -15 | -1 | – |
| Price | -18 | -29 | -13 | -35 | -5 | -19 | -31 | – |
| Security | 12 | 5 | -8 | 22 | 5 | 19 | 16 | – |
| Spread adjustment (total) | -12 | -51 | -41 | -38 | -16 | -14 | -16 | – |
| Adjusted OAS | 234 | 220 | 201 | 298 | 300 | 325 | 284 | 287 |
Source: Morgan Stanley Research, ICE BofA, July 2025. OAS = option-adjusted spread. There is no guarantee that past trends will continue or forecasts will be realised.
What could upset spreads?
It would be remiss of us not to consider the potential risks that could see spreads gap wider. In the near term, we could face some nervousness around the US government shutdown. The playbook tends to be similar each time with lawmakers failing to agree, only for there to be a climbdown. President Trump’s unpredictability makes this harder to call, but it is unlikely the executive or lawmakers would want to be unpopular for long. Delayed economic data might be the biggest source of anxiety.
Share buybacks tend to slow down during the quarterly reporting period. This might mean there is some technical weakness in early October in equity markets. High yield and equities tend to be more correlated so it could lead to spreads widening slightly but this may offer a buying opportunity.
Perhaps the biggest threat would be some shocking economic data that either signified a recession (unlikely given what we described earlier) or a pick-up in inflation. Higher inflation isn’t necessarily a bad thing for credit if it feeds through to revenues and earnings but concern that the Fed or other major central banks may switch to raising interest rates would be unwelcome.
Summary
Taken together, spreads may be tight, but they reflect a demand from investors for yield and an expectation that the economy and corporate conditions are likely to remain benign over the near term. What is more, tight spreads can create something of a positive feedback loop as it makes it cheaper for companies to raise capital or refinance. The danger is when complacency sets in – but we think we are some way off that.
Footnotes:
1Source: Bloomberg, ICE BofA US High Yield Bond Index, ICE BofA Euro High Yield Index, Govt option-adjusted spreads, 30 September 2025.
2Source: US department of Labor, Unemployment Insurance Weekly Claims, 25 September 2025.
3Source: Tax Foundation, 13 August 2025.
4Source: S&P Global, HCOB, Eurozone Services PMI, HCOB Eurozone Manufacturing PMI, September 2025.
5Source: LSEG I/B/E/S, S&P 500 data at 19 September 2025, Russell 2000 at 11 September 2025, and STOXX 600 at 23 September 2025.
6Source: Morgan Stanley, earnings are earnings before interest, tax, depreciation and amortisation 22 September 2025.
7Source: Citi Research, LCD, 1 October 2025.
Important information
Fixed income securities are subject to interest rate, inflation, credit and default risk. The bond market is volatile. As interest rates rise, bond prices usually fall, and vice versa. The return of principal is not guaranteed, and prices may decline if an issuer fails to make timely payments or its credit strength weakens.
High-yield or “junk” bonds involve a greater risk of default and price volatility and can experience sudden and sharp price swings.
*****
About the authors
Brent Olson, Portfolio Manager
Brent Olson is a Portfolio Manager at Janus Henderson Investors, a role he has held since 2019. Brent rejoined Janus Henderson in 2017 as a credit analyst. Prior to this, he was a lead portfolio manager at Scout Investments on a growth equity strategy that emphasised fixed income metrics and credit data points to select stocks. Before Scout, he oversaw high-yield and leveraged equity research as well as managed fixed income products at Three Peaks Capital Management from 2005 until 2013. From 2000 until 2004, Brent was an investment analyst at Invesco Funds Group. He started his financial career in 1997 as a credit analyst with Janus until 2000.
Tom Ross, CFA, Head of High Yield, Portfolio Manager
Tom Ross is Head of High Yield at Janus Henderson Investors, a role he has held since 2022. In this role, Tom is responsible for leading investment strategy and portfolio management of the firm’s high yield
Copyright © Janus Henderson