by Richard Bernstein, Richard Bernstein Advisors
Liquidity has been a primary driver of financial asset returns over the past several years. Liquidity-driven markets are not unusual, but the breadth of speculative activity resulting from the Fed’s generosity since the pandemic began seems unprecedented. Expensive equity valuations, historically tight credit spreads, individuals’ increased use of investment leverage, and the ongoing bubble in numerous cryptocurrencies all seem to reflect excess liquidity leading to widespread speculation.
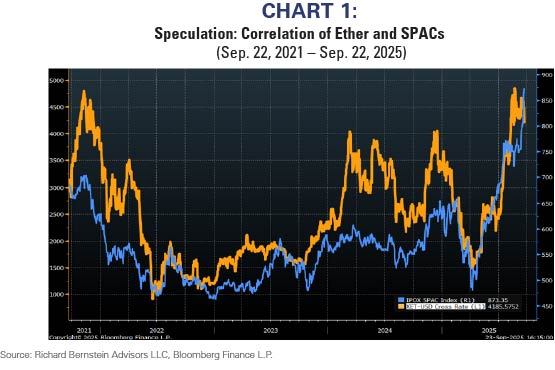
Chart 1 supports the notion that speculation is indeed broad by showing the correlation between Ether and SPACs. The correlation between two seemingly unrelated assets likely reflects easy liquidity conditions fostering speculation rather than performance related to a fundamental assessment of each asset’s future worth.
At the beginning of an investment cycle, consensus typically forms that Fed rate cuts will prove impotent in lowering the cost of capital, boosting financial markets, and ultimately stimulating the economy. In late cycle periods, however, investors act like junkies waiting for the Fed to provide another liquidity fix.
If investors are acting more like liquidity junkies than disbelievers, the risk to such speculative investing could be that the Fed can’t provide more liquidity. The current healthy economy and inflation that remains well above the Fed’s target rate suggest that risk shouldn’t be ignored.
The Fed is the Central Bank
Investors seem to have forgotten that the Fed is the US’s Central Bank and influences the overall economy via the banking system. When banks are hindering economic growth because they are restricting lending, the Fed cuts rates which lowers the cost of capital for banks. The Fed hopes that lowering the cost of bank funding to offset the banks’ perceived lending risk will encourage banks to lend more and, in turn, boost economic growth.
When the banking system is lending too much and boosting nominal growth to unsustainable or damaging levels, the Fed typically raises interest rates to try to make banks’ funding costs more expensive. The Fed hopes that more expensive capital will cause lending to slow, which in turn, will slow the economy.
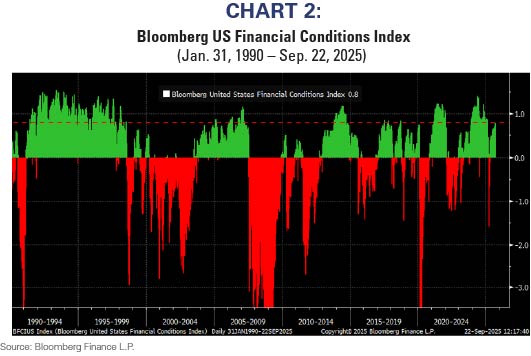
Chart 2 shows the Bloomberg Financial Conditions Index, which measures the availability of capital across a broad range of markets. Current financial conditions are very easy relative to history, meaning that companies have easy access to capital.
Investors witness easy access to capital in many asset classes. Corporate spreads are historically narrow, SPACs have become an acceptable method for businesses to become public companies, and private investment funds continue to raise capital.
Should the Fed be cutting rates?
The Fed isn’t asking any of us whether they should cut rates, so a discussion regarding whether the Fed “should” cut rates is fruitful only from the perspective of unintended consequences and potential resulting investment ideas.
Besides easy financial conditions, there are other factors that might question why the Fed feels the need to cut rates: 1) the economy is healthy, 2) inflation expectations are rising, 3) trade agreements have resulted in supply chain shocks, and 4) immigration restrictions are limiting labor supply.
In addition, the Fed doesn’t appear to fully recognize that ongoing deglobalization and financial bubbles are both inherently inflationary.
1. The overall economy
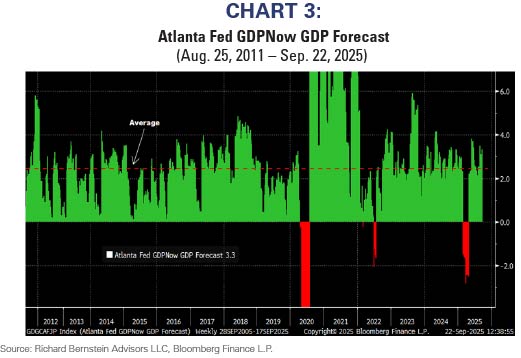
The Atlanta Fed’s GDPNow real-time tracker of the US economy is suggesting economic growth above the long-term average (see Chart 3).
2. Inflation expectations
Tariffs haven’t raised inflation by as much as many investors (including RBA) thought they would. However, tariffs have indeed pushed up inflation expectations. Chart 4 shows how “Liberation Day” definitively boosted the Fed’s favorite measure of inflation expectations. [1]

3. Supply chain shocks
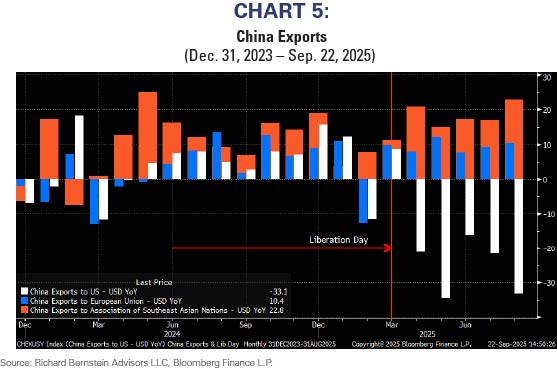
Chart 5 shows how China exports to the US have fallen off. One could argue restricting Chinese goods is important for the longer-term health of the US economy. Nonetheless, restricting US imports from China is a significant supply chain disruption for the US economy, and supply chain disruptions are usually inflationary (i.e., supply is constrained relative to demand).
Importantly, the inflationary spiral of the 1970s was significantly fueled by supply chain disruptions, but they were called “oil embargoes”.
4. Labor supply disruptions
Supply chain disruptions typically refer to distortions in the supply of goods, but they can also occur with the supply of labor. Recent immigration policies, whether correct or incorrect, are constraining the supply of labor. If one assumes the economy remains somewhat healthy and the demand for labor doesn’t subside, then the result could be the price of labor (i.e., wages) will rise.
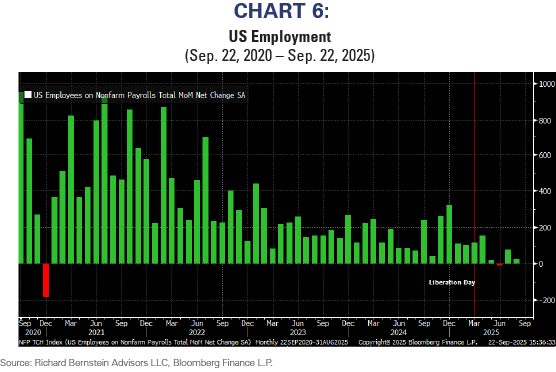
Some economists have suggested the recent weak US employment reports have been caused by immigration restrictions. That might be the case, but it also seems likely that companies have been attempting to swallow the tariffs and squeeze margins rather than raise prices and potentially lose market share. Margin pressures could be causing the recent shortfalls in employment (see Chart 6).
The Fed cut rates: 2 outcomes
Regardless of what the Fed should or should not do, they have cut rates and are signaling their intent to cut rates further. We think there could be two potential financial market outcomes.
First, the response to the Fed cutting rates could be a broadening of the equity markets. That would be a very healthy outcome because a broader stock market would imply the Fed has reignited a healthy lending cycle, which in turn would spur stronger profits and economic cycles.
The second response could be the Fed rate cuts simply result in more excess liquidity and more speculation. With existing easy financial conditions, investors might use the added liquidity to further speculate. This could ultimately foster a very bad outcome.
Bubbles are inherently inflationary
We have repeatedly emphasized over the past 30 years that bubbles are inherently inflationary because they grossly misallocate capital within an economy. In other words, capital flows to things not needed in the economy, while truly necessary investment goes ignored.
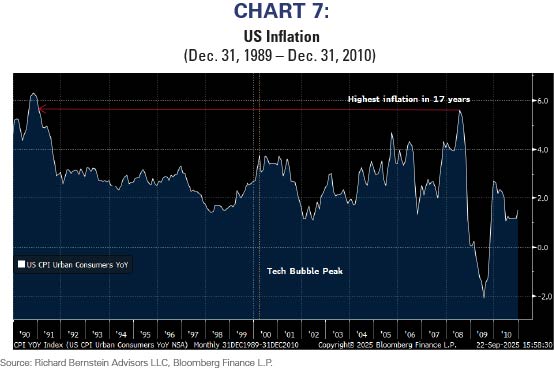
During the Technology Bubble, we argued that energy was the sector being starved of capital despite the massive need for investment. The bubble’s misallocation of capital led Energy to be the best performing sector during the 2000s, and the US CPI peaked at 5.6% before the global financial crisis destroyed economic growth and inflation fell (see Chart 7).
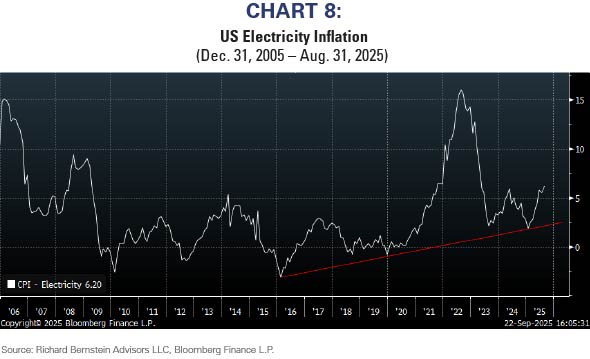
There is a similar misallocation of capital within the US economy today. Simply put, imagine if all the capital going into cryptocurrencies instead was invested in the US electric grid. We strongly doubt electricity prices would be rising more than 6% per year as they currently are if that had been the case.
So, WTF
So, investors need to carefully watch the Fed and the markets’ responses to their actions:
-
The possibility that inflation isn’t dead and employment isn’t waning. The Fed might have to go on hold or even reverse course and raise rates. This is the worst case scenario for financial markets fueled by liquidity and speculation, but might be good for the relative performance of value, dividends, non-technology quality, and more broadly diversified portfolios.
-
The possibility that employment is much worse than expected and a series of large rate cuts ensue. This isn’t a particularly good scenario either because it implies the economy and earnings are demonstrably weaker than consensus forecasts. Defensive sectors would likely outperform in this environment.
-
The Fed’s rate cuts are very timely, and the economy reaccelerates without much inflation. This would result in a broadening of the market in a very healthy way.
-
The Fed adds unnecessary liquidity to the financial markets and speculation runs rampant. This might be fun for some investors in the short-term, but it could create serious misallocations within the economy and add to significant future inflation.
We think RBA’s portfolios are well-geared to the first three scenarios. As investors know well, we do not speculate and remain disciplined macro investors.
[1] 5-year 5-year inflation breakevens are a market-based measure of inflation expectations. Effectively, they attempt to measure inflation expectations from years 6 to 10 within a 10-year time frame. The goal is to remove the effect of shorter-term data volatility and cyclical effects to get a more accurate assessment of secular inflation expectations.
INDEX DESCRIPTIONS: The following descriptions, while believed to be accurate, are in some cases abbreviated versions of more detailed or comprehensive definitions available from the sponsors or originators of the respective indices. Anyone interested in such further details is free to consult each such sponsor’s or originator’s website. The past performance of an index is not a guarantee of future results. Each index reflects an unmanaged universe of securities without any deduction for advisory fees or other expenses that would reduce actual returns, as well as the reinvestment of all income and dividends. An actual investment in the securities included in the index would require an investor to incur transaction costs, which would lower the performance results. Indices are not actively managed and investors cannot invest directly in the indices.Dow Jones Utility Average: The Dow Jones Utility Average Index is a price-weighted average of 15 utility companies that are listed on the New York Stock Exchange and are involved in the production of electrical energy. The average as it is known today began on January 2, 1929 with a base value of 50. Dow Jones U.S. Dividend Index: Dow Jones U.S. Dividend 100 Total Return Index measures the stock performance of high dividend yielding U.S. companies with a record of consistently paying dividends, selected for fundamental strength relative to their peers, based on financial ratios. It is calculated in USD with dividends reinvested. Nasdaq: The Nasdaq Composite Index: The NASDAQ Composite Index is a broad-based market-capitalization-weighted index of stocks that includes all domestic and international based common type stocks listed on The NASDAQ Stock Market. Mag 7: The Magnificent 7 (Mag 7) are a group of 7 widely-traded companies classified in the United States and representing the Communications, Consumer Discretionary and Technology sectors as defined by the Global Industry Classification Standard (GICS®) developed by MSCI Barra and Standard & Poor’s. These consist of AAPL, AMZN, GOOGL, META, MSFT, NVDA and TSLA.


