by Trevor Greetham, Head of Multi-Asset, Royal London Asset Management
The Federal Reserve (Fed) is cutting rates for the first time since March 2020. What happens to financial markets in the months to come will depend on the macro backdrop.
Historically, rate cuts amid disinflationary growth have been bullish for stocks. If a US recession takes hold, however, rate cuts have not prevented a bear market and investors would have fared better buying stocks on the Fed’s last rate cut, not the first. There’s a more consistent pattern for government bonds, which typically perform strongly either way.
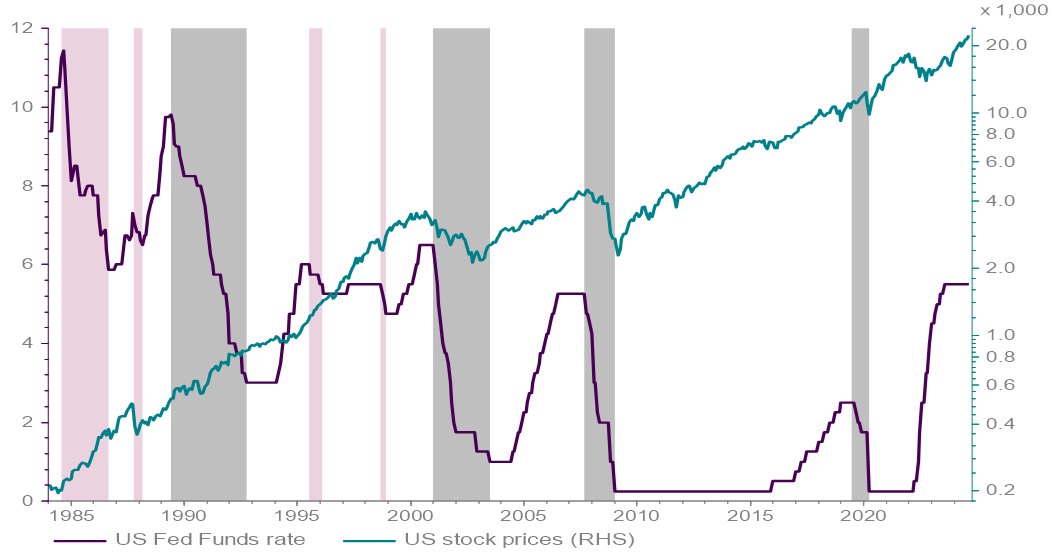
The eight Fed easing cycles over the last 40 years have averaged 17 months in duration. They split into four linked to recessions and four to disinflationary mid cycle 'soft landings' (Chart 1).
Chart 1: Federal Funds target rate and US Stock Prices

Source: RLAM and LSEG Datastream as at 01/08/2024. Fed easing cycles shaded in grey around full-blown US recessions and pink around soft landings. Past performance is not a guide to future performance.
The following patterns emerge:
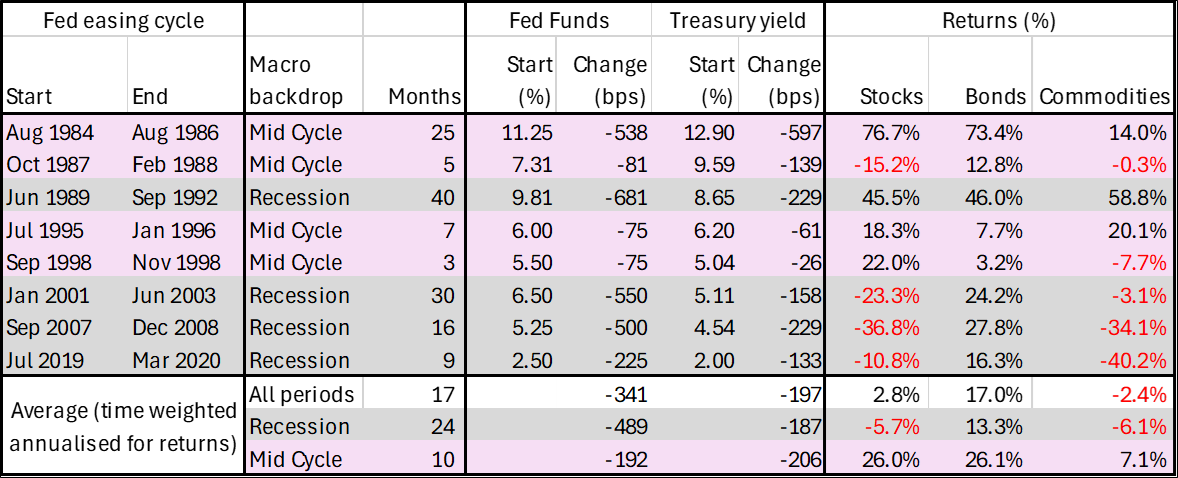
- Fed Funds dropped an average 341 basis points with 10-year US treasury yields down 197bps (Table 1). Rate cuts were more aggressive in recessions, but bonds performed well either way.
- Stocks usually saw steep losses during recessions but rallied very strongly in soft landings.
- Commodities were mixed, dropping sharply in recessions, with the Gulf War an exception.
Table 1: Financial market behaviour during Federal Reserve easing cycles

Source: RLAM. Changes between first and last Fed rate cuts. Total returns in US dollars using S&P Composite index for stocks, 10-year US Treasuries for bonds and the GSCI index for commodities. Past performance is not a guide to future performance.
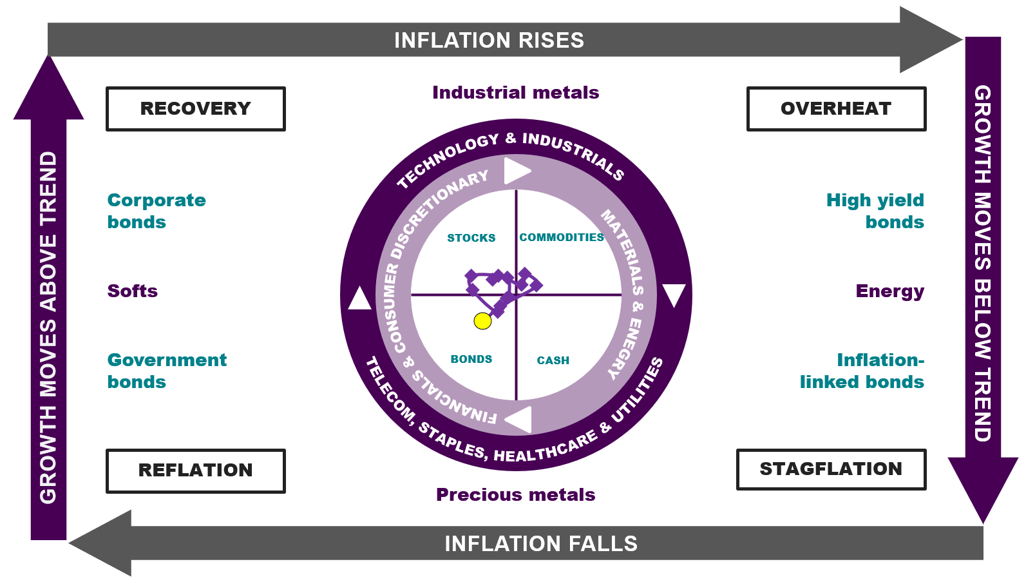
These findings are consistent with the Investment Clock model we use to guide our asset allocation (Chart 2). We are in the disinflationary Reflation phase of the business cycle which usually sees central banks cut rates, with government bonds doing well and commodities poorly. Stocks tend to do best in disinflationary Recovery when central banks continue to ease policy for inflation reasons. The soft landings of the 1980s and 1990s are good examples of this positive scenario.
Chart 2: The Investment Clock is in Reflation

Source: RLAM as at September 2024. For illustrative purposes only. Trail shows monthly readings based on global growth and inflation indicators.
In our view, a recession heading into 2025 is possible but by no means a foregone conclusion. Monetary tightening takes effect with long and unpredictable lags, some manufacturing surveys are weak, US employment data is soft and China is in a structural downturn. However, a broader swathe of US activity data remains strong, unemployment rates are low and European economies, including the UK, have firmed up of late and this evidence points towards a soft landing.
It may be that recent market volatility turns out to be seasonal – or linked to the divisive and close-run US presidential election. If so, market jitters may present an opportunity to buy stocks for the traditional year-end rally, fuelled by Fed rate cuts, lower bond yields and, potentially, renewed leadership from the interest rate sensitive US technology sector.
This is a financial promotion and is not investment advice. Past performance is not a guide to future performance. The value of investments and any income from them may go down as well as up and is not guaranteed. Investors may not get back the amount invested. Portfolio characteristics and holdings are subject to change without notice. The views expressed are those of the author at the date of publication unless otherwise indicated, which are subject to change, and is not investment advice.
Copyright © Royal London Asset Management


