The Bottom Line
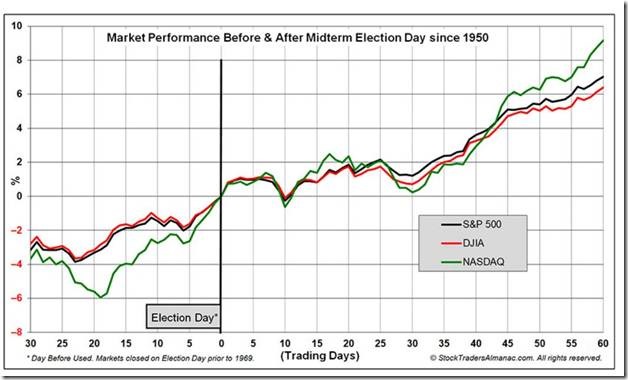
Focus this week is on the mid-term U.S. Congressional elections on Tuesday. Current polls suggest that the Republicans will win more seats and will regain control over the House of Representatives. Current polls also show a close race for 35 Senate seats with control of the Senate hanging in the balance. Close races in the Senate and House suggest that final results may not be available for another two weeks after the election until contested results are finalized. History shows that volatility in U.S. equity indices increases, but net price change during the two week period is limited After the two week period, broadly based U.S. equity indices have a history of moving significantly higher regardless of final results until at least the end of the year. Strength was notable during the proverbial “Christmas Rally” period from December 16th to January 6th. “Risk on” indices led the gain.
Chart courtesy of StockTradersAlmanac.com
The “Christmas Rally” this year ties in with another important event, the next FOMC meeting held December 14th –December 15th. Chances are high that the FOMC will announce an increase in the Fed Fund Rate one last time by 0.50%-0.75%. Equity markets will respond accordingly.
Consensus for Earnings and Revenues for S&P 500 Companies
Analysts once again lowered estimates for the remainder of 2022. As of Friday, 85% of S&P 500 companies had reported third quarter results. According to www.factset.com third quarter earnings on a year-over-year basis are expected to increase 2.2% and revenues are expected to increase 10.5% (versus an increase of 9.3% last week). Fourth quarter earnings are expected to decrease 1.0% (versus previous increase of 0.5%) and revenues are expected to increase 4.4% (versus previous increase at 4.9%). For 2022 earnings are expected to increase 5.5% (versus previous increase of 6.1%) and revenues are expected to increase 7.2% (versus previous increase of 10.4%).
Preliminary estimates for 2023 also moved lower. According to www.factset.com first quarter 2023 earnings are expected to increase 2.3% (versus previous estimate at 3.2%) and revenues are expected to increase 3.9% (versus previous estimate at 4.3%). Second quarter 2023 earnings are expected to increase 1.5% (versus previous estimate at 2.0%) and revenues are expected to increase 1.3% (versus previous estimate at 1.6%). For all of 2023, earnings are expected to increase 5.9% (versus previous estimate at 6.4%)) and revenues are expected to increase 3.4% (versus previous estimate at 3.7%).
Economic News This Week
Focus this week is on the CPI report on Thursday
U.S. October Consumer Price Index released at 8:30 AM EDT on Thursday is expected to increase 0.7% versus a gain of 0.4% in September. On a year-over-year basis, October Index is expected to increase 8.0% versus 8.2% in September. Excluding food and energy, the Index is expected to increase 0.5% versus a gain of 0.6% in September. On a year-over-year basis, the Index is expected to increase 6.5% versus 6.6% in September.
November Michigan Consumer Sentiment released at 10:00 AM EDT on Friday is expected to slip to 59.0 from 59.9 in October.
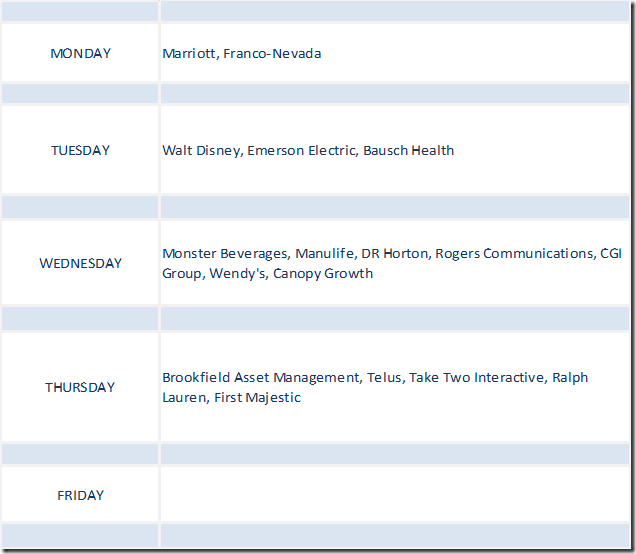
Selected Earnings News This Week
Trader’s Corner
Equity Indices and Related ETFs
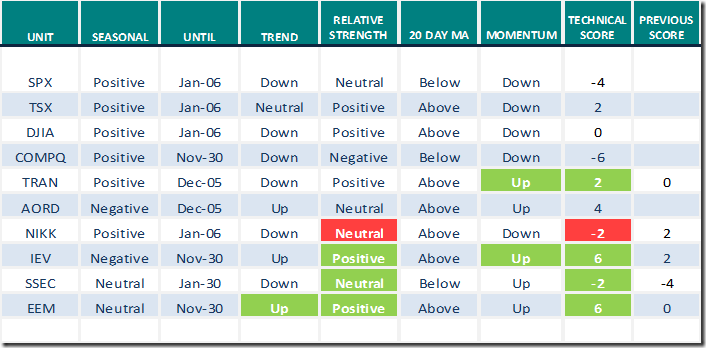
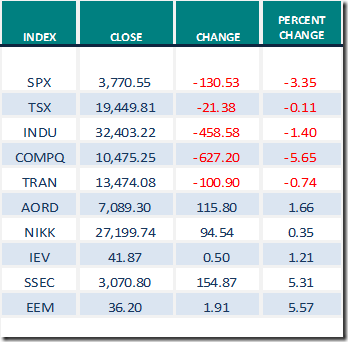
Daily Seasonal/Technical Equity Trends for November 4th 2022
Green: Increase from previous day
Red: Decrease from previous day
Commodities
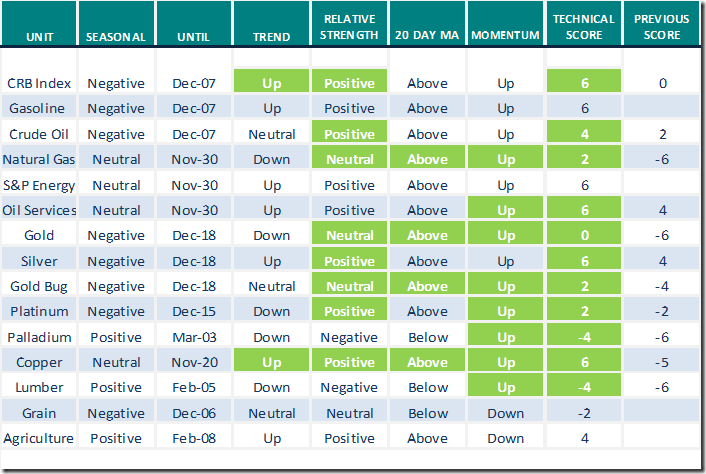
Daily Seasonal/Technical Commodities Trends for November 4th 2022
Green: Increase from previous day
Red: Decrease from previous day
Sectors
Daily Seasonal/Technical Sector Trends for November 4th 2021
Green: Increase from previous day
Red: Decrease from previous day
Early Bird Opportunity to Register for WOFC
Michael Campbell’s next live annual World Outlook Financial Conference in Vancouver is scheduled on February 3rd and February 4th 2023. Participants can purchase tickets at a discount if purchased early. Following is a link to background information and registration.
WOFC 2023 Event Info (mikesmoneytalks.ca)
Next Canadian Association for Technical Analysis meeting
Next meeting is at 8:00 PM EST on Tuesday November 8th. Speaker is Agnieszka Wood. Not a member of CATA? Contact Us – Canadian Association for Technical Analysis (clubexpress.com)
Technical Scores
Calculated as follows:
Intermediate Uptrend based on at least 20 trading days: Score 2
(Higher highs and higher lows)
Intermediate Neutral trend: Score 0
(Not up or down)
Intermediate Downtrend: Score -2
(Lower highs and lower lows)
Outperformance relative to the S&P 500 Index: Score: 2
Neutral Performance relative to the S&P 500 Index: 0
Underperformance relative to the S&P 500 Index: Score –2
Above 20 day moving average: Score 1
At 20 day moving average: Score: 0
Below 20 day moving average: –1
Up trending momentum indicators (Daily Stochastics, RSI and MACD): 1
Mixed momentum indicators: 0
Down trending momentum indicators: –1
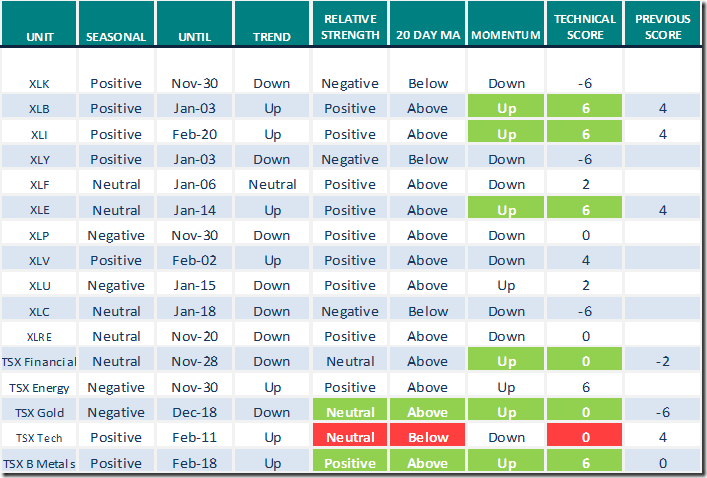
Technical scores range from -6 to +6. Technical buy signals based on the above guidelines start when a security advances to at least 0.0, but preferably 2.0 or higher. Technical sell/short signals start when a security descends to 0, but preferably -2.0 or lower.
Long positions require maintaining a technical score of -2.0 or higher. Conversely, a short position requires maintaining a technical score of +2.0 or lower
Changes Last Week
Charts of the day
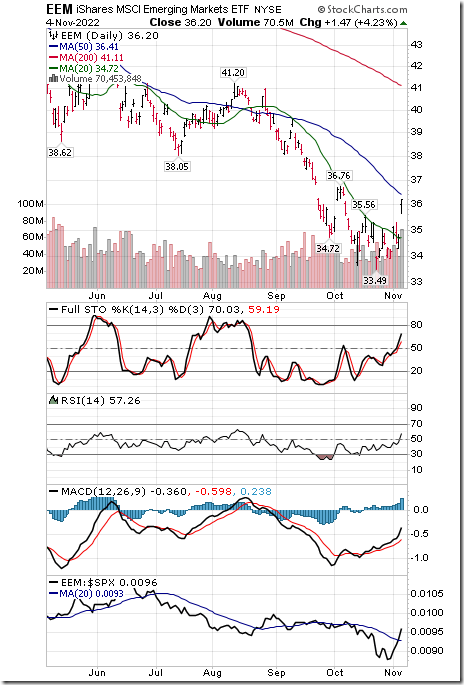
Emerging Markets iShares $EEM moved above $35.56 on Friday. Trend changed from down to up (Score: -2 to +2) and strength relative to the S&P 500 changed from Neutral to Positive (Score: 0 to +2). Price was above its 20 day moving average (Score: 1) and daily momentum indicators were trending up (Score: 1). Total score increased from 0 to +6.
CRB Index moved above 285.62 on Friday on U.S. Dollar weakness completing a double bottom pattern. Trend changed from Down to Up (Score: -2 to +2). Strength relative to the S&P 500 changed from Neutral to Positive (Score: 0 to +2). Index remained above its 20 day moving average (Score: 1). Daily momentum indicators continued higher (Score: 1). Total score increased from 0 to +6. Crude oil, gold, silver and copper prices led the advance.
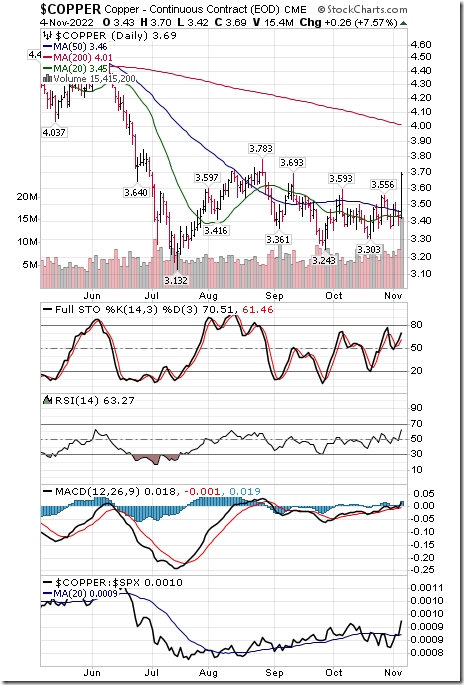
Spot Copper moved above $3.59 per lb. on Friday. Intermediate trend changed from down to up (Score: -2 to +2). Strength relative to the S&P 500 changed from Negative to Positive (Score:-2 to +2). Price moved from at its 20 day moving average to above its 20 day moving average (Score: 0 to +1). Daily momentum indicators continued to trending higher (Score: 1). Total technical score improved from -5 to +6. Copper equity prices responded accordingly.
Links offered by valued providers
Mark Leibovit’s comment for November 3rd
Are Fed Rate Hikes Inflationary? – HoweStreet
Michael Campbell’s Money Talks for November 5th
Michael Campbell’s MoneyTalks – Complete Show (mikesmoneytalks.ca)
Greg Schnell says: “The NASDAQ, a tough market to gauge”. A review of last week’s trends
The Nasdaq: A Tough Market to Gauge | The Canadian Technician | StockCharts.com
Mary Ellen McGonagle says “Not all boats are sinking with Market’s tide.”
Mary Ellen McGonagle asks “Should you buy the pullback?”
https://www.youtube.com/watch?v=C1QcS43MIek
John Hopkins says “Market is stuck…which is extremely bullish”.
Market is Stuck — Which is Extremely Bullish | Top Advisors Corner | StockCharts.com
Tom Bowley says “The VIX is screaming to GET In NOW”
Ed Steer says “Gold and silver explode higher in New York”
Gold & Silver Explode Higher in New York – HoweStreet
Bob Hoye on gold, stocks, bonds and commodities for November 4th
Gold, Stocks, Bonds, Commodities – HoweStreet
Links from Mark Bunting and www.uncommonsenseinvestor.com
Growth or Balanced Growth. Which is Right for You? – Uncommon Sense Investor
Growth Portfolios Not Just for Younger Investors. Here’s Why. – Uncommon Sense Investor
Victor Adair’s Trading Notes for November 5th
https://victoradair.ca/trading-desk-notes-for-november-5-2022/
Technical Scoop for November 7th from David Chapman and www.EnrichedInvesting.com
Technical Notes for Friday
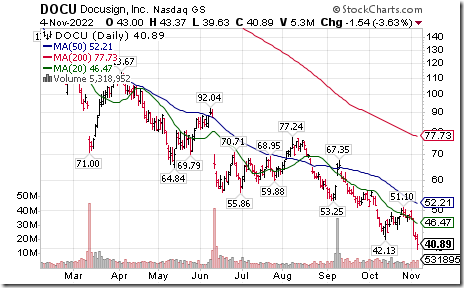
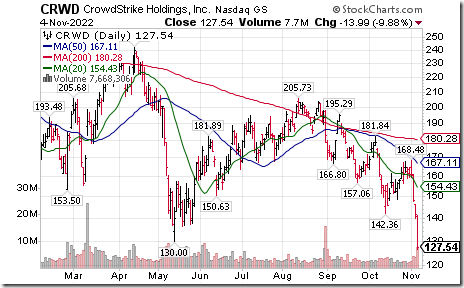
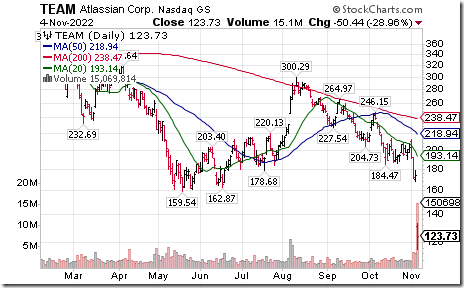
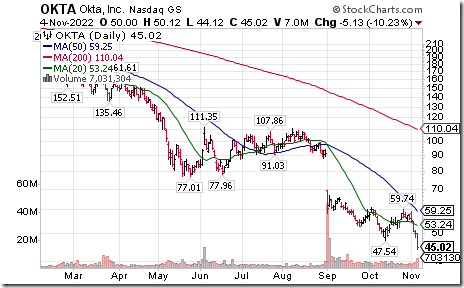
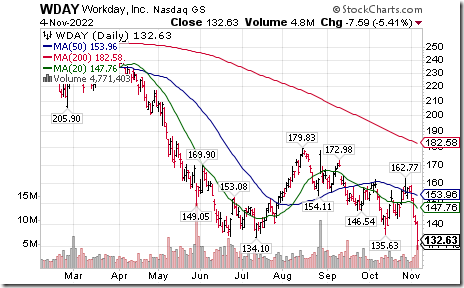
Selected NASDAQ 100 stocks remain under technical pressure extending intermediate downtrends. Workday $WDAY moved below $135.63, Cadence $CDNS moved $142.34, DocuSign moved below $42.13, CrowdStrike $CRWD moved below $130.00, Atlassian $TEAM moved below $109.54, Activision $ATVI moved below $71.75, Verisk Analytics $VRSK and Okta $OKTA moved below $47.54.
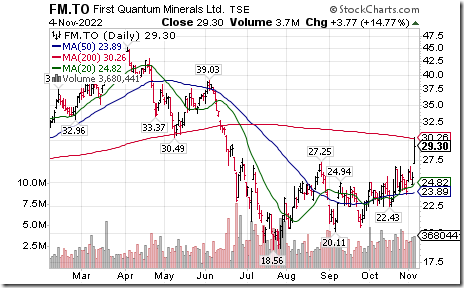
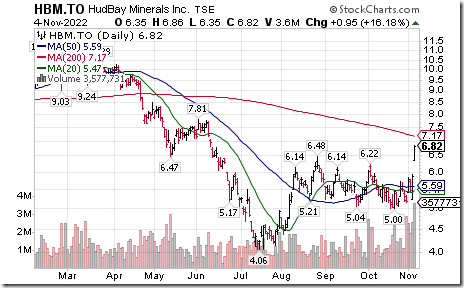
Base metal equities and related ETFs $PICK $XBM.TO $XME $ZMT.TO $COPX moved sharply higher in response to higher base metal prices. Individual base metal equities that were notably higher included $FCX $FM.TO $HBM.TO $SCCO. Strength was triggered by weakness in the U.S. Dollar Index and its related ETN: UUP
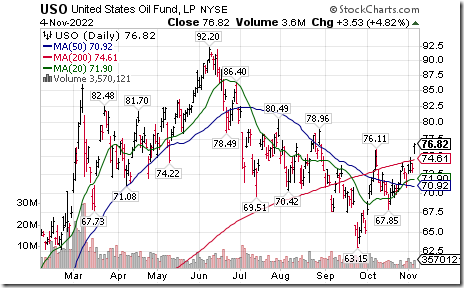
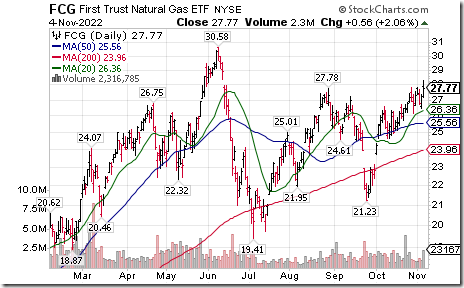
U.S. energy equities and related ETFs responded to higher crude oil, natural gas and gasoline prices. Crude oil ETN $USO moved above $76.11 extending an intermediate uptrend. First Trust Natural Gas ETF $FCG moved above $30.58 extending an intermediate uptrend.
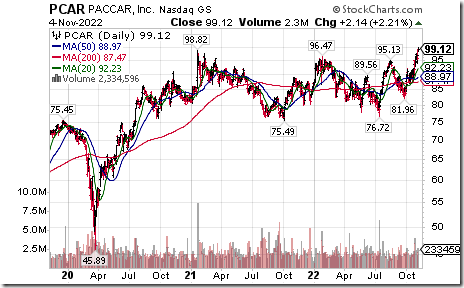
PACCAR $PCAR a NASDAQ 100 stock moved above $98.82 to an all-time high extending an intermediate uptrend.
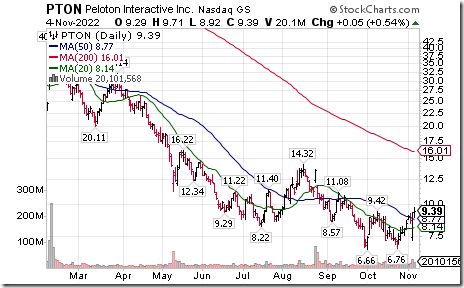
Peloton $PTON a NASDAQ 100 stock moved above $9.42 completing a double bottom pattern.
S&P 500 Momentum Barometers
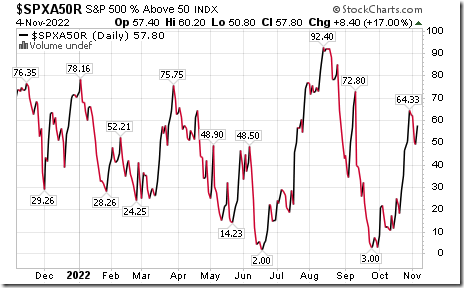
The intermediate term Barometer gained 8.40 on Friday, but dropped 6.53 last week to 57.80. It changed from Overbought to Neutral on a return below 60.00.
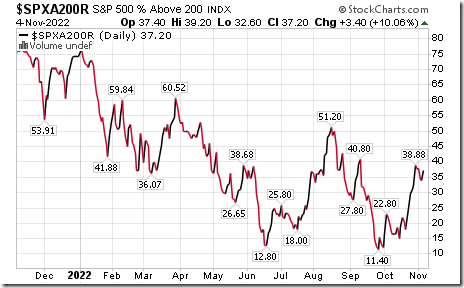
The long term Barometer added 3.40 on Friday, but slipped 1.68 last week to 37.20. It remains Oversold.
TSX Momentum Barometers
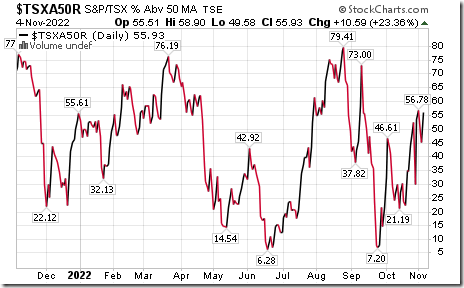
The intermediate term Barometer advanced 10.59 on Friday and 3.39 from THURSDAY October 27th to 55.93 (Accurate data for October 28th was not available). It remains Neutral.
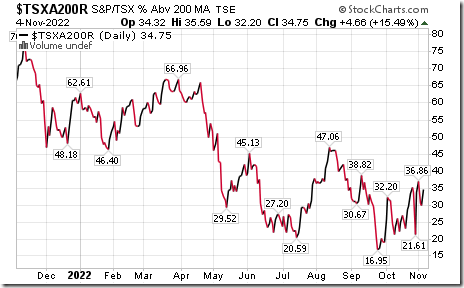
The long term Barometer added 4.66 on Friday and 0.85 from THURSDAY October 27th to 34.75. (Accurate data for October 28th was not available). It remains Oversold.
Disclaimer: Seasonality ratings and technical ratings offered in this report and at
www.equityclock.com are for information only. They should not be considered as advice to purchase or to sell mentioned securities. Data offered in this report is believed to be accurate, but is not guaranteed


