Technical Notes for yesterday
Editor’s Note: All breakouts occurred prior to 1:00 PM EDT yesterday
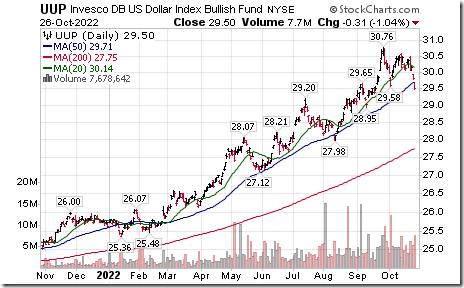
U.S. Dollar Index ETN $UUP moved below $29.58 completing a double top pattern.
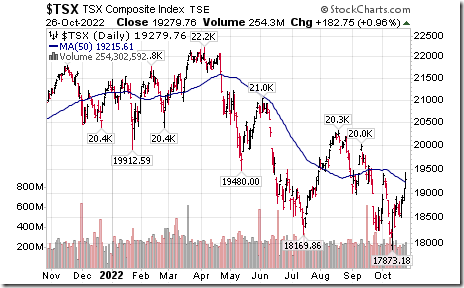
TSX Composite Index moved above its 50 day moving average.
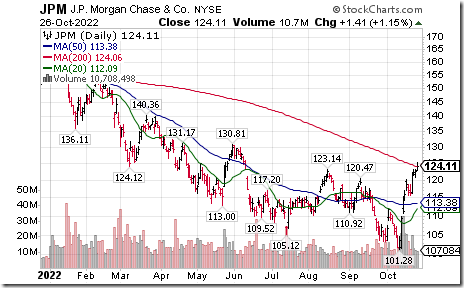
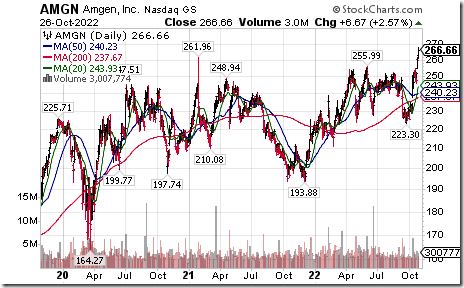
Strength in the Dow Jones Industrial Average was helped by intermediate/long term breakouts by Nike, JP Morgan and Amgen
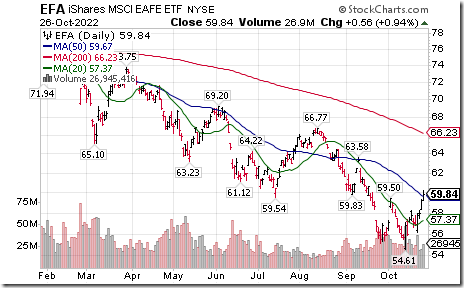
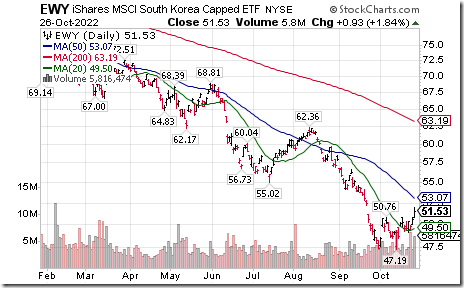
Equity indices and related ETFs outside of North America also are showing positive technical action. EAFA iShares $EFA moved above intermediate resistance at $59.50. South Korea iShares $EWY moved above $50.76 completing a double bottom pattern. Australia iShares $EWA moved above intermediate resistance at $20.92.
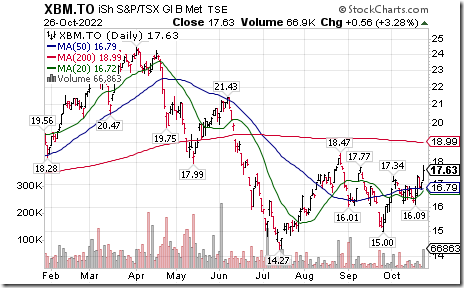
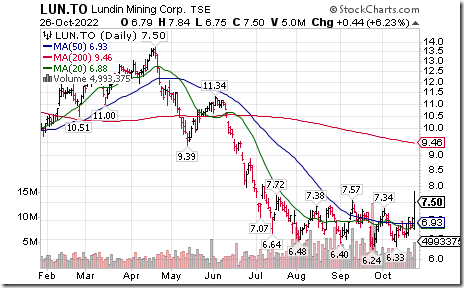
Base metal equities and related ETFs $XBM.TO $PICK are moving above intermediate resistance. Individual equities in the sector also are moving above base building patterns (e.g. Lundin Mining on a move above Cdn.17.34).
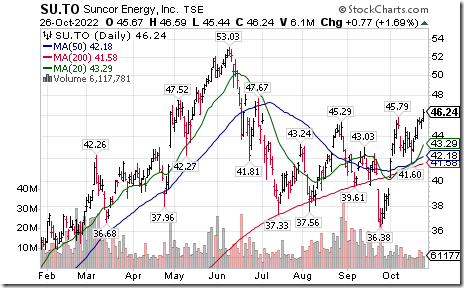
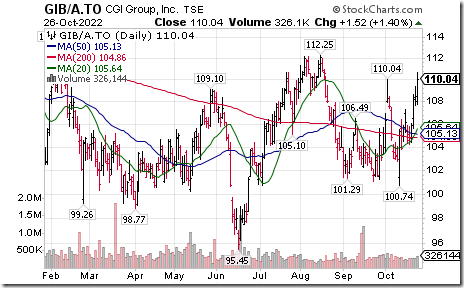
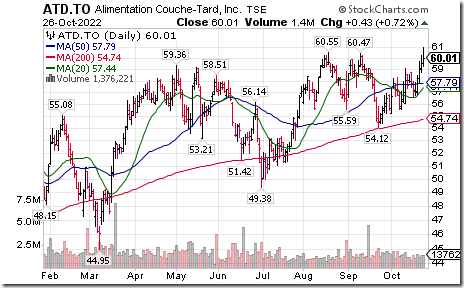
TSX 60 stocks breaking intermediate resistance included Suncor $SU.TO, Canadian Pacific $CP.TO, CGI $GIB.A.TO and Couche Tard $ATD.TO. Couche Tard moved to an all-time high.
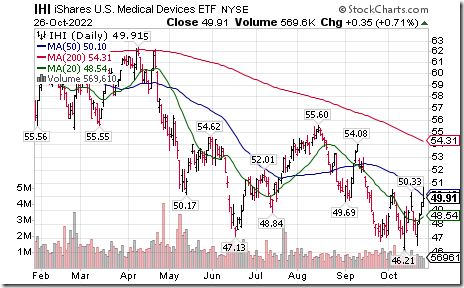
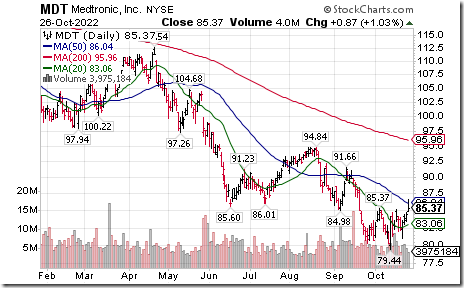
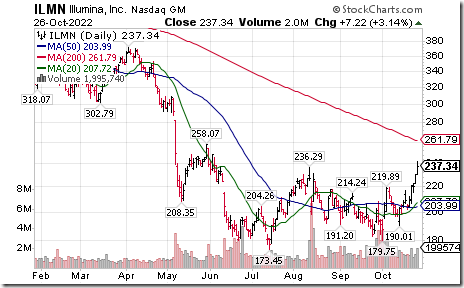
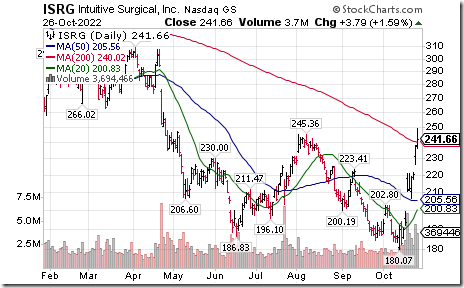
U.S. Medical Devices iShares $IHI moved above intermediate resistance at $50.52. Medtronic $MDT an S&P 100 stock and medical device stock moved above $85.37 completing a double bottom pattern. Illumina $ILMN a NASDAQ 100 stock moved above $236.29 completing a double bottom pattern. A related medical device equity Intuitive Surgical (ISRG) moved above$245.36 completing a double bottom pattern.
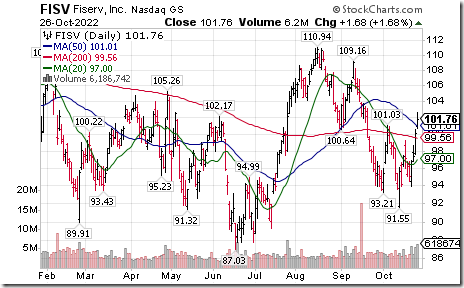
Fiserv $FISV a NASDAQ 100 stock moved above intermediate resistance at $101.03.
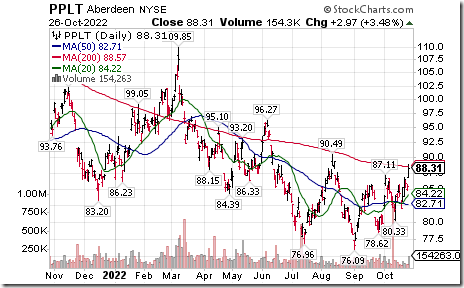
Platinum ETN $PPLT moved above $87.11 extending an intermediate uptrend
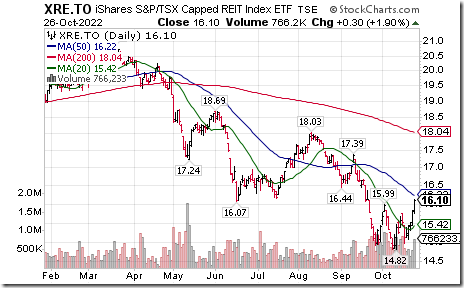
TSX Cap REIT iShares $XRE.TO moved above intermediate resistance at $15.99.
Trader’s Corner
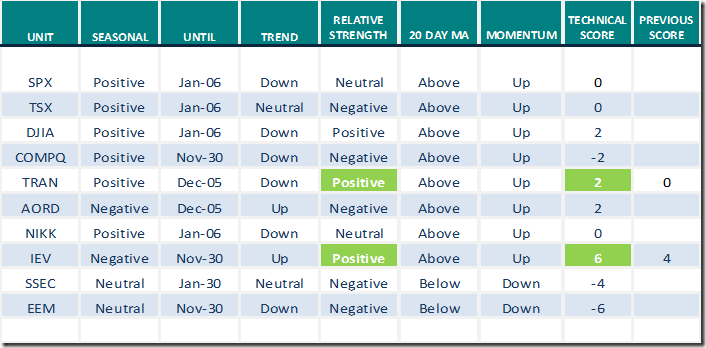
Equity Indices and Related ETFs
Daily Seasonal/Technical Equity Trends for October 26th 2022
Green: Increase from previous day
Red: Decrease from previous day
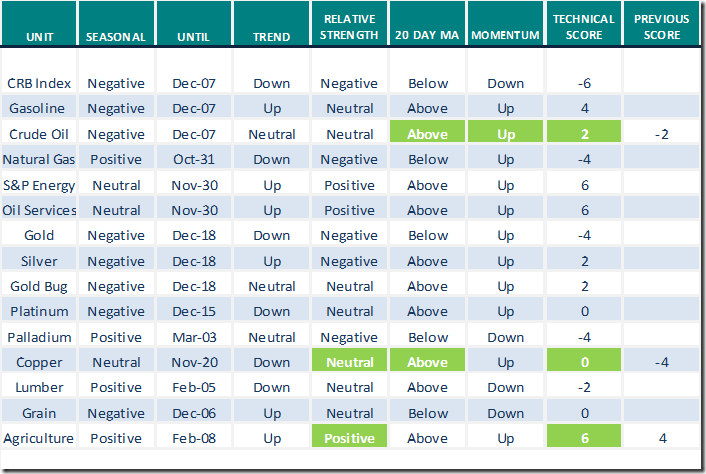
Commodities
Daily Seasonal/Technical Commodities Trends for October 26th 2022
Green: Increase from previous day
Red: Decrease from previous day
Sectors
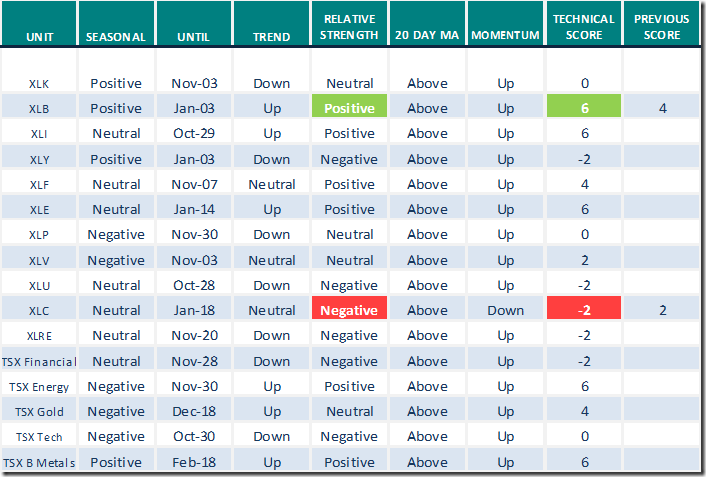
Daily Seasonal/Technical Sector Trends for October 26th 2021
Green: Increase from previous day
Red: Decrease from previous day
Links offered by valued providers
Link from Mark Bunting and www.uncommonsenseinvestor.com
"Tremendous Opportunities" for Investors Despite "Rolling Recession" – Uncommon Sense Investor
Greg Schnell asks “Is crypto a buy here”?
Is Crypto A Buy Here? | Greg Schnell, CMT | Market Buzz (10.24.22) – YouTube
Jane Galina discusses “The rise of silver”. (In response to a weak U.S. Dollar Index)
The Rise Of Silver | Jane Gallina | Your Daily Five (10.26.22) – YouTube
Chart of the Day
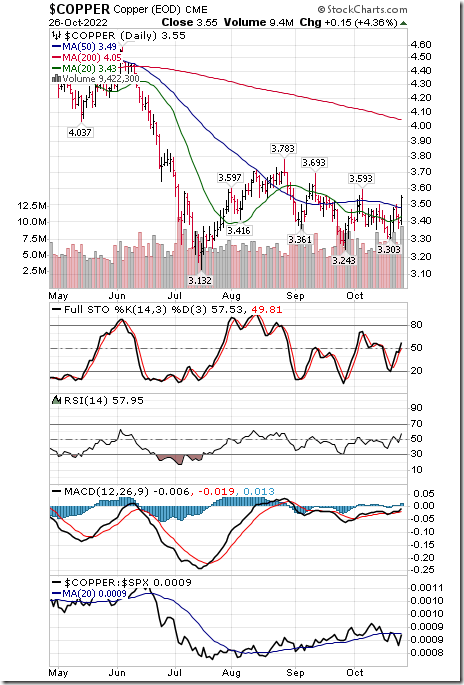
Technical score for Copper futures increased from -4 to 0 when strength relative to the S&P 500 Index changed from Negative to Neutral (-2 to 0) and price moved above its 20 day moving average (-1 to +1). Technical score increased from -4 to 0. Also, price moved above its 50 day moving average. Base metals equities and related ETFs (e.g. COPX, PICK, XBM.TO, DBB, ZMT.TO) have a similar technical profile. Seasonal influences turn positive in November.
S&P 500 Momentum Barometers
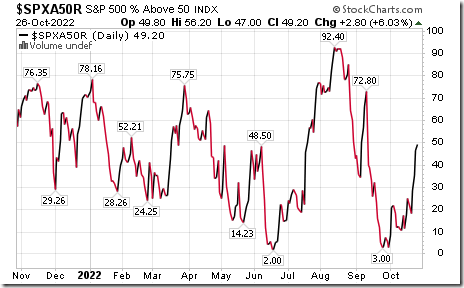
The intermediate term Barometer added 2.80 to 49.20. It remains Neutral. Trend remains up.
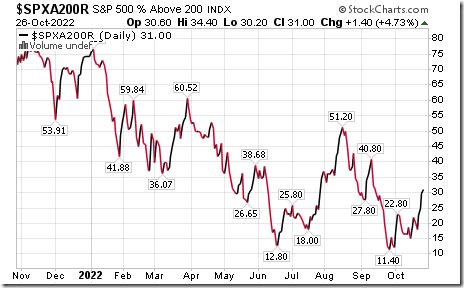
The long term Barometer added 1.40 to 31.00. It remains Oversold. Trend remains up.
TSX Momentum Barometers
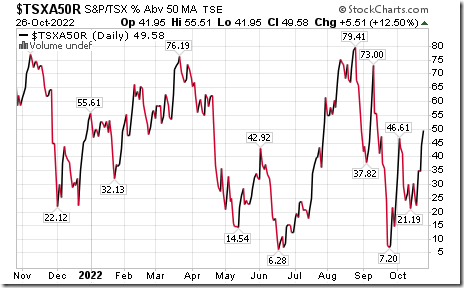
The intermediate term Barometer added 5.51 to 49.58. It remains Neutral. Trend remains up.
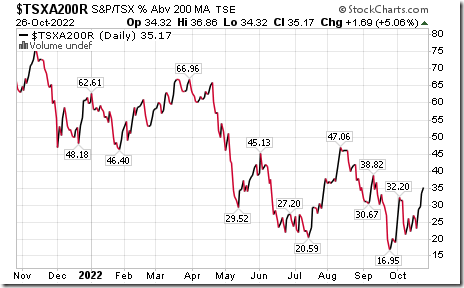
The long term Barometer added 1.69 to 35.17. It remains Oversold. Trend remains up.
Disclaimer: Seasonality ratings and technical ratings offered in this report and at
www.equityclock.com are for information only. They should not be considered as advice to purchase or to sell mentioned securities. Data offered in this report is believed to be accurate, but is not guaranteed


