by Don Vialoux, EquityClock.com
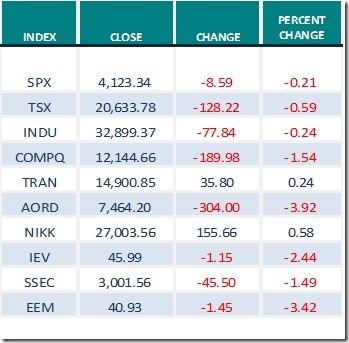
Weakness in North American equity markets continued last week. Focus was more on the U.S. Federal Reserve’s plan to tighten monetary policy than reporting of better than consensus first quarter results. In addition, analysts became more cautious about consensus earnings estimates for the remainder of the year. Earnings growth in the second quarter is expected to be robust, but at a lower growth rate than the first quarter.
Observations
Volatility in U.S. equity markets remains elevated.
Consensus earnings estimate for S&P 500 companies on a year-over-year basis in the first quarter of 2022 increased again last week. Eight seven percent of companies have reported quarterly results to date. According to www.FactSet.com first quarter earnings on a year-over-year basis are expected to increase 9.1% (versus 7.1% last week) and revenues are expected to increase 13.3% (versus 11.2% last week)
Consensus earnings estimates for S&P 500 companies beyond the first quarter on a year-over-year basis were reduced again. According to www.FactSet.com second quarter earnings are expected to increase 4.8% (versus 5.5% last week) and revenues are expected to increase 9.8% (versus 9.7% last week). Earnings in the third quarter are expected to increase 10.6% (versus 11.7% last week) and revenues are expected to increase 9.0% (versus 8.8% last week). Earnings in the fourth quarter are expected to increase 10.1% (versus 11.2% last week) and revenues are expected to increase 7.2%. Earnings on a year-over-year basis for all of 2022 are expected to increase 10.1% (versus 11.0% last week) and revenues are expected to increase 10.0% (versus 9.8% last week).
Economic News This Week
Focus this week is on U.S. inflation reports to be released on Wednesday and Thursday.
April Consumer Price Index to be released at 8:30 AM EDT on Wednesday is expected to increase 0.2% versus a gain of 1.2% in March. On a year-over-year basis, April Consumer Price Index is expected to increase 8.1% versus a gain of 8.5% in March. Excluding food and energy, April Consumer Price Index is expected to increase 0.4% versus a gain of 0.3% in March. On a year-over-year basis, April Consumer Price Index is expected to increase 6.0% versus a gain of 6.5% in March.
April Producer Price Index to be released at 8:30 AM EDT on Thursday is expected to increase 0.5% versus a gain of 1.4% in March. On a year-over-year basis, April Producer Price Index is expected to increase 10.7% versus a gain of 11.2% in March. Excluding food and energy April Producer Price Index is expected to increase 0.6% versus a gain of 1.0% in March. Excluding food and energy, April Producer Price Index is expected to increase 8.9% versus 9.2% in March.
May Michigan Consumer Sentiment to be released at 10:00 AM EDT on Friday is expected to drop to 64.0 from 65.2 in April.
Selected Earnings News This Week
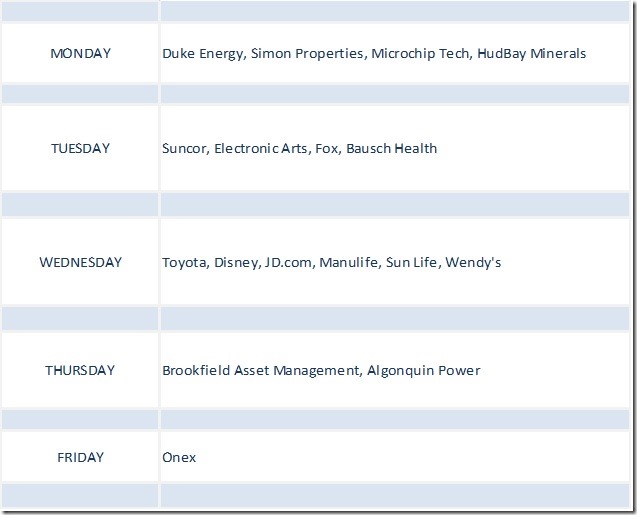
Eighty seven percent of S&P 500 companies have reported first quarter results to date. Another 20 S&P 500 companies (and one Dow Jones Industrial Average company: Disney) are scheduled to release quarterly results this week.
Frequency of quarterly reports released by TSX 60 companies reaches a peak this week.
Trader’s Corner
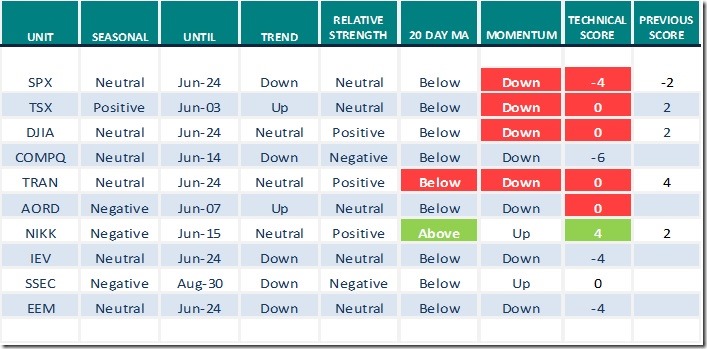
Equity Indices and Related ETFs
Daily Seasonal/Technical Equity Trends for May 6th 2022
Green: Increase from previous day
Red: Decrease from previous day
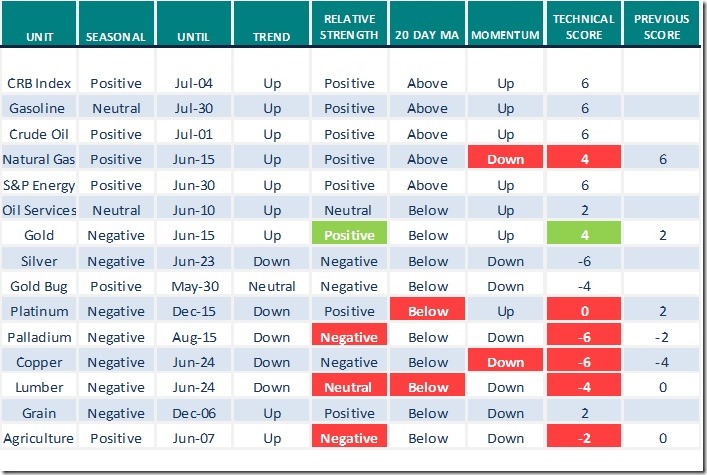
Commodities
Daily Seasonal/Technical Commodities Trends for May 6th 2022
Green: Increase from previous day
Red: Decrease from previous day
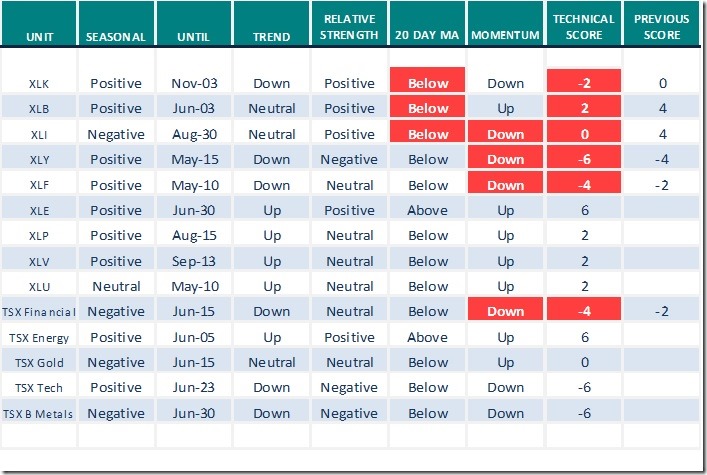
Sectors
Daily Seasonal/Technical Sector Trends for May 6th 2021
Green: Increase from previous day
Red: Decrease from previous day
All seasonality ratings are based on performance relative to the S&P 500 Index (except TSX)
Links offered by Valued Providers
Greg Schnell asks “Is this the Equity markets problem”?
Is This The Equity Markets Problem? | The Canadian Technician | StockCharts.com
Greg Schnell says “Bond yields explode higher.”
Bond Yields Explode Higher | Greg Schnell, CMT | Your Daily Five (05.06.22) – YouTube
Are You Missing These Setups? Energy Stocks Break Out! | The Canadian Technician | StockCharts.com
Mark Leibovit on interest rate hikes, food shortages and Russia versus Ukraine
Interest Rate Hikes, Food Shortages, Russia vs. Ukraine – HoweStreet
Josef Schachter’s comments on
Crude Oil, Natural Gas, Interest Rates, Inflation. Josef Schachter – May 5, 2022
https://www.youtube.com/watch?v=3zLkRGYFO5E&list=PLCrz-HEf8_0CJ-6mzlZREyFNdhOphzYMG&index=2
Michael Campbell’s Money Talks for May 7th
May 7th Episode (mikesmoneytalks.ca)
Victor Adair’s Trading Notes for May 7th
https://victoradair.ca/trading-desk-notes-for-may-7-2022/
Links from Mark Bunting and www.uncommonsenseinvestor.com
How to Solve Amazon’s "Too Much Space" Problem – Uncommon Sense Investor
These Nine Charts Tell the Story of the Current Market – Uncommon Sense Investor
At 78, Investor Preps for ‘Biggest Bear Market in My Life’ (yahoo.com)
Paul Tudor Jones Says Preserve Capital, Avoid Stocks and Bonds (businessinsider.com)
David Keller discusses “The most important chart of the day”.
https://stockcharts.com/articles/mindfulinvestor/2022/05/the-most-important-chart-of-th-738.html
Technical Scores
Calculated as follows:
Intermediate Uptrend based on at least 20 trading days: Score 2
(Higher highs and higher lows)
Intermediate Neutral trend: Score 0
(Not up or down)
Intermediate Downtrend: Score -2
(Lower highs and lower lows)
Outperformance relative to the S&P 500 Index: Score: 2
Neutral Performance relative to the S&P 500 Index: 0
Underperformance relative to the S&P 500 Index: Score –2
Above 20 day moving average: Score 1
At 20 day moving average: Score: 0
Below 20 day moving average: –1
Up trending momentum indicators (Daily Stochastics, RSI and MACD): 1
Mixed momentum indicators: 0
Down trending momentum indicators: –1
Technical scores range from -6 to +6. Technical buy signals based on the above guidelines start when a security advances to at least 0.0, but preferably 2.0 or higher. Technical sell/short signals start when a security descends to 0, but preferably -2.0 or lower.
Long positions require maintaining a technical score of -2.0 or higher. Conversely, a short position requires maintaining a technical score of +2.0 or lower
Changes Last Week
Technical Notes released on Friday at
Emerging Markets iShares $EEM moved below $40.80 extending an intermediate downtrend.
Global Agriculture iShares $COW.CA moved below Cdn$74.52 completing a short term Head & Shoulders pattern.
Watching the comparisons of the market now to what was seen in 2018, the last time that the yield on the 10-year Treasury note crossed above 3%. equityclock.com/2022/05/05/… $SPX $SPY $STUDY $TNX $IEF $TLT
Nonfarm payrolls in the US expanded by 1.071 million, or 0.7% (NSA), in April, which, excluding the COVID induced drawdown in 2020, is inline with the average change for this time of year. The trajectory of payrolls this year remains above the seasonal norm. $MACRO $STUDY #Economy #Employment #NFP
Nonfarm payrolls in the US expanded by 1.071 million, or 0.7% (NSA), in April, which, excluding the COVID induced drawdown in 2020, is inline with the average change for this time of year. The trajectory of payrolls this year remains above the seasonal norm. $MACRO $STUDY #Economy #Employment #NFP
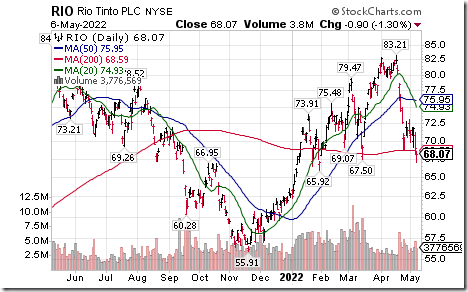
Base metal stocks remain under technical pressure. Rio Tinto $RIO moved below intermediate support at $67.50, Southern Copper $SCCO moved below $60.39 and First Quantum Minerals $FM.CA moved below Cdn$33.16.
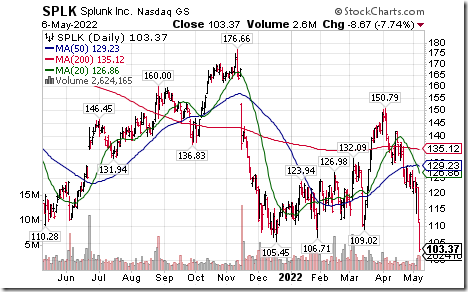
Splunk $SPLK a NASDAQ 100 stock moved below $105.45 extending an intermediate downtrend.
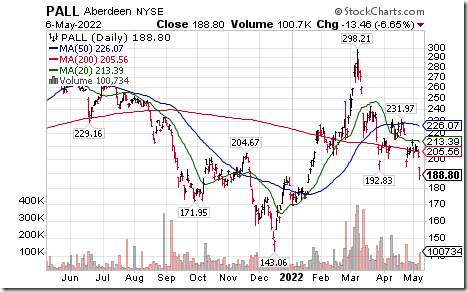
Palladium ETN $PALL moved below $192.83 extending an intermediate downtrend.
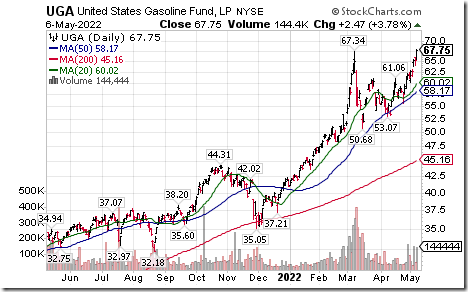
Gasoline ETN $UGA moved above $67.34 extending an intermediate uptrend.
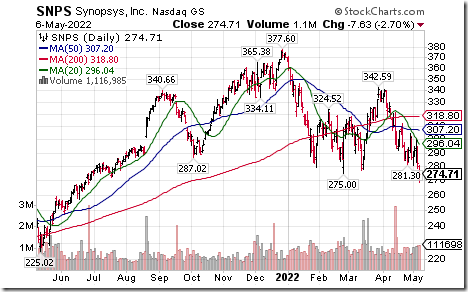
Synopys $SNPS a NASDAQ 100 stock moved below $275.00 extending an intermediate downtrend.
DexCom $DXCM a NASDAQ 100 stock moved below $365.73 extending an intermediate downtrend.
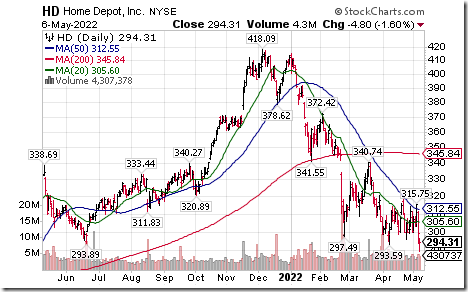
Home Depot $HD a Dow Jones Industrial Average stock moved below $293.59 extending an intermediate downtrend.
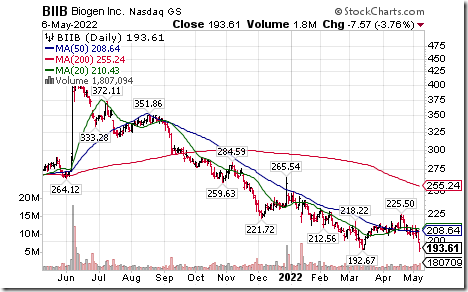
Biogen $BIIB a NASDAQ 100 stock moved below $192.67 extending an intermediate downtrend.
S&P 500 Momentum Barometers
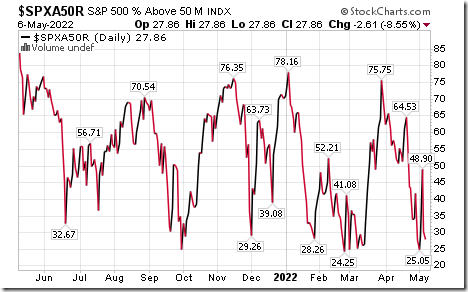
The intermediate term Barometer slipped 2.61 on Friday, but added 0.20 last week to 27.86. It remains Oversold. Signs of bottom have yet to be confirmed.
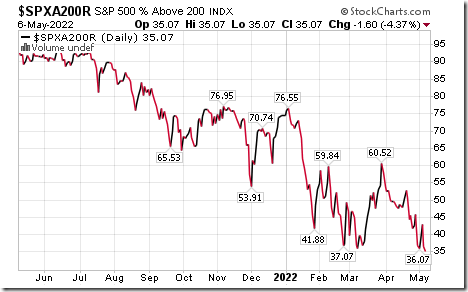
The long term Barometer eased 1.60 on Friday and 2.00 last week to 35.07 It remains Oversold. Signs of a bottom have yet to be confirmed.
TSX Momentum Barometers
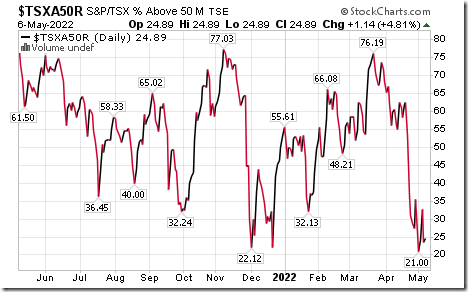
The intermediate term Barometer added 1.14 on Friday and 1.89 last week to 24.89. It remains Oversold. Signs of a bottom have yet to be confirmed.
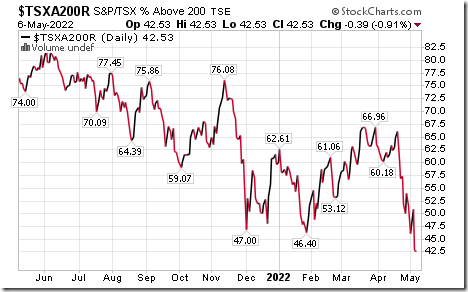
The long term Barometer eased 0.39 on Friday and dropped 9.07 last week to 42.53. It remains Neutral. Trend is down.
Disclaimer: Seasonality and technical ratings offered in this report and at
www.equityclock.com are for information only. They should not be considered as advice to purchase or to sell mentioned securities. Data offered in this report is believed to be accurate, but is not guaranteed.
This post was originally publised at Vialoux's Tech Talk.


