by Don Vialoux, EquityClock.com
The Bottom Line
World equity indices were mostly lower again last week. Greatest influences are ramping up of a fourth wave by COVID 19 (negative) and continued expansion of distribution of a COVID 19 vaccine (positive).
Observations
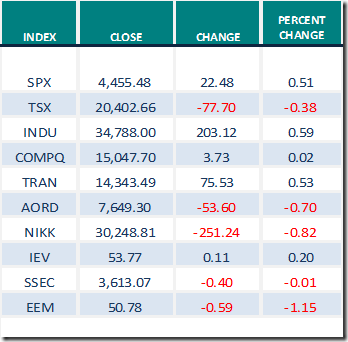
Developed world equity indices were mixed last week. U.S. equity indices were slightly higher while Far East, European and the TSX Composite Index were slightly lower.
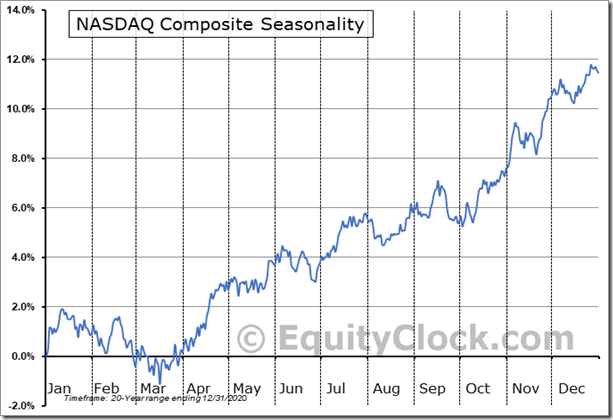
The NASDAQ Composite Index and the NASDAQ 100 Index have a history of reaching a seasonal low this week followed by their strongest advance in the year to the first week in January. Both indices are heavily weighted in the Technology sector.
Short term short term indicators for U.S. equity indices and sectors (20 day moving averages, short term momentum indicators) moved higher last week.
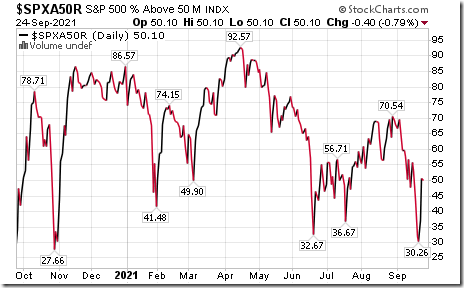
Intermediate term technical indicator for U.S. equity markets (Percent of S&P 500 stocks trading above their 50 day moving average) moved higher last week. It remained Neutral. See Barometer chart at the end of this report.
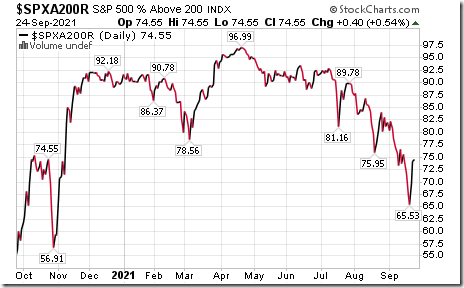
Long term technical indicator for U.S. equity markets (Percent of S&P 500 stocks trading above their 200 day moving average) was virtually unchanged last week. It remained Overbought. See Barometer chart at the end of this report.
Short term momentum indicators for Canadian indices and sectors moved higher last week.
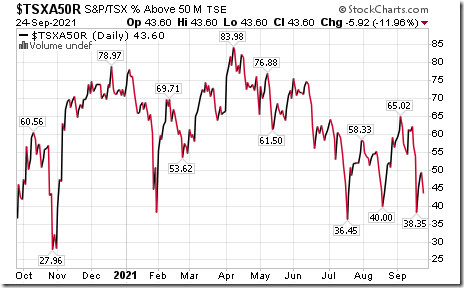
Intermediate term technical indicator for Canadian equity markets moved lower again last week. It remained Neutral and is trending down. See Barometer chart at the end of this report.
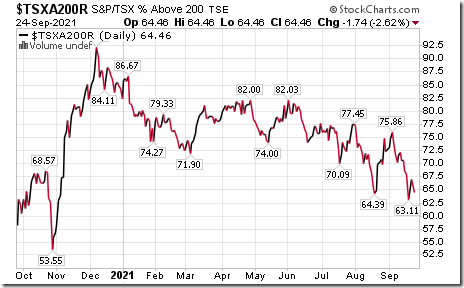
Long term technical indicator for Canadian equity markets (Percent of TSX stocks trading above their 200 day moving average) were virtually unchanged last week. It remained Overbought. See Barometer charts at the end of this report.
Consensus estimates for earnings and revenues in 2021 by S&P 500 companies were virtually unchanged again last week. According to www.FactSet.com Earnings in the third quarter are projected to increase 27.6% and revenues are projected to increase 14.9% (versus 14.8% last week). Earnings in the fourth quarter are projected to increase 21.5% (versus previous estimate at 21.6%) and revenues are projected to increase 11.3%. Earnings for all of 2021 are projected to increase 42.6% and revenues are projected to increase 14.9%.
Earnings and revenue growth continues in 2022, but at a slower pace. .Consensus earnings in 2022 by S&P 500 companies are projected to increase 9.5% and revenues are projected to increase 6.7% (versus 6.6% last week). Consensus earnings for the first quarter are projected to increase 5.5% on a year-over-year basis (versus 5.6% last week) and revenues are expected to increase 8.2% (versus 8.1% last week).
Economic News This Week
August Durable Goods Orders to be released at 8:20 AM EDT on Monday are expected to increase 0.6% versus a decline of 0.1% in July. Excluding aircraft orders, August Durable Goods Orders are expected to increase 0.5% versus a gain of 0.8% in July.
Updated annualized second quarter real GDP to be released at 8:30 AM EDT on Thursday is expected to remain unchanged at 6.6%.
September Chicago PMI to be released at 9:45 AM EDT on Thursday is expected to slip to 65.0 from 66.8 in August.
August Personal Income to be released at 8:30 AM EDT on Friday is expected to increase 0.3% versus a gain of 1.1% in July. August Personal Spending is expected to increase 0.6% versus a gain of0.3% in July.
July Canadian GDP to be released at 8:30 AM EDT on Friday is expected to drop 0.3% versus a gain of 0.7% in June.
September ISM Manufacturing Index to be released at 10:00 AM EDT on Friday is expected to slip to 59.6 from 59.9 in August.
September Michigan Consumer Sentiment to be released at 10:00 AM EDT on Friday is expected to remain unchanged from August at 71.0.
Selected Earnings News This Week
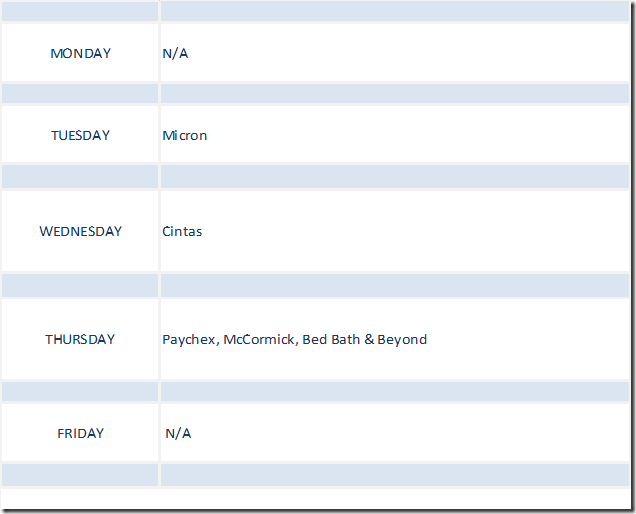
Six S&P 500 stocks are scheduled to release quarterly results this week. No TSX 60 companies are scheduled to report.
Trader’s Corner
Equity Indices and Related ETFs
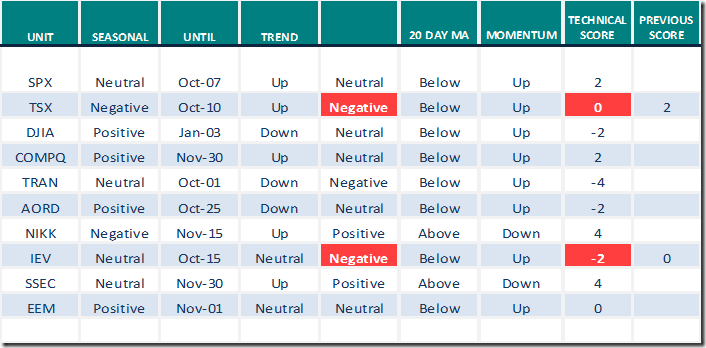
Daily Seasonal/Technical Equity Trends for September 24th 2021
Green: Increase from previous day
Red: Decrease from previous day
Commodities
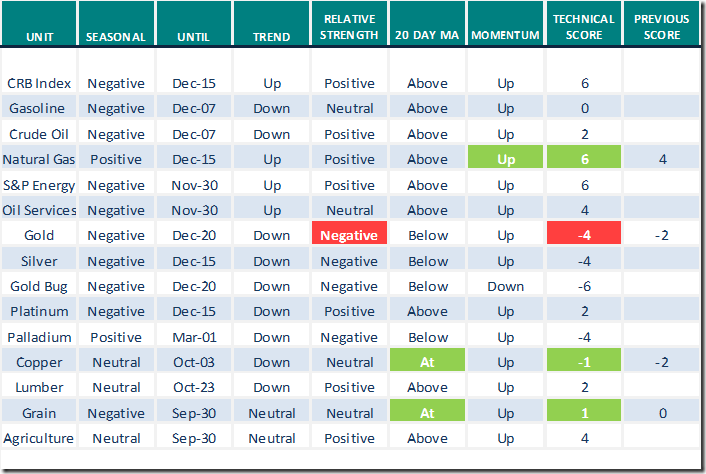
Daily Seasonal/Technical Commodities Trends for September 24th 2021
Green: Increase from previous day
Red: Decrease from previous day
Sectors
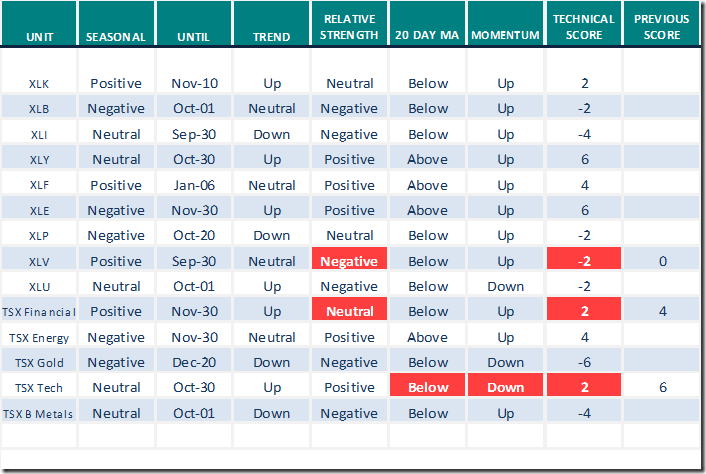
Daily Seasonal/Technical Sector Trends for September 24th 2021
Green: Increase from previous day
Red: Decrease from previous day
All seasonality ratings are based on performance relative to the S&P 500 Index
Technical Scores
Calculated as follows:
Intermediate Uptrend based on at least 20 trading days: Score 2
(Higher highs and higher lows)
Intermediate Neutral trend: Score 0
(Not up or down)
Intermediate Downtrend: Score -2
(Lower highs and lower lows)
Outperformance relative to the S&P 500 Index: Score: 2
Neutral Performance relative to the S&P 500 Index: 0
Underperformance relative to the S&P 500 Index: Score –2
Above 20 day moving average: Score 1
At 20 day moving average: Score: 0
Below 20 day moving average: –1
Up trending momentum indicators (Daily Stochastics, RSI and MACD): 1
Mixed momentum indicators: 0
Down trending momentum indicators: –1
Technical scores range from -6 to +6. Technical buy signals based on the above guidelines start when a security advances to at least 0.0, but preferably 2.0 or higher. Technical sell/short signals start when a security descends to 0, but preferably -2.0 or lower.
Long positions require maintaining a technical score of -2.0 or higher. Conversely, a short position requires maintaining a technical score of +2.0 or lower
Changes Last Week
Links from valued providers
A comment from Greg Schnell: Coal is back!
It’s Black. | The Canadian Technician | StockCharts.com
A comment from Tom Bowley: Bullish opinion on the Consumer Discretionary sector.
This Sector Is Turning The Bullish Corner; Higher Prices Ahead | ChartWatchers | StockCharts.com
Technical Scoop
Thank you to David Chapman and www.EnrichedInvesting.com for a link to the following weekly report:
Michael Campbell’s Money Talks for September 25th
Entire Show – September 25th (mikesmoneytalks.ca)
Links offered by Mark Bunting and www.uncommonsenseinvestor.com
"Persistent Inflation" Will Kill the Bull Market But Not Yet – Uncommon Sense Investor
Are "Relentless" Inflows & Speculation Distorting Prices? – Uncommon Sense Investor
The "Dean of Valuation" On Four Big Tech Companies – Uncommon Sense Investor
McCullough: Here’s How You Should Trade → Use Volatility (Not Your Emo (hedgeye.com)
9 Top Sports Betting Stocks to Wager On | Kiplinger
6 cheap restaurant stocks that will fatten up your portfolio: analyst (yahoo.com)
All 30 Dow Stocks Ranked: The Pros Weigh In | Kiplinger
Technical Notes released on Friday at
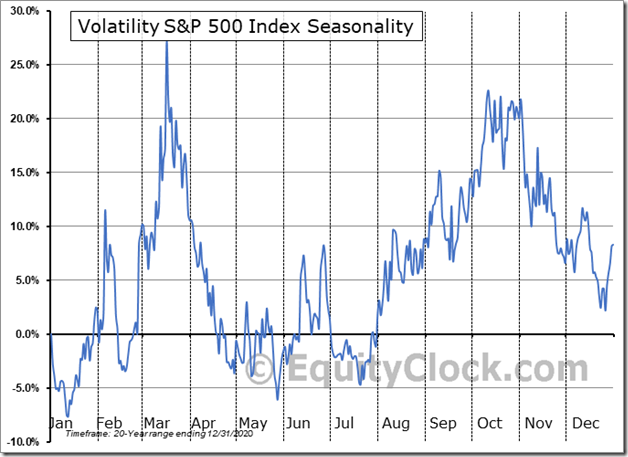
Another week remains in the period of peak volatility for stocks, but we are starting to see some enticing setups that fulfill the technical and fundamental requirements that our strategy encompasses now. equityclock.com/2021/09/23/… $VIX $STUDY $SPX $SPY $ES_F $XLI $XLB $XLE
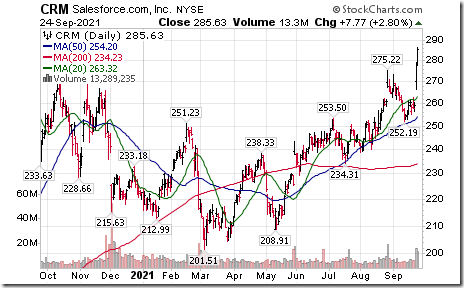
Salesforce $CRM a Dow Jones Industrial Average stock moved above $284.50 to an all-time high after at least three brokers raised their target price on the stock
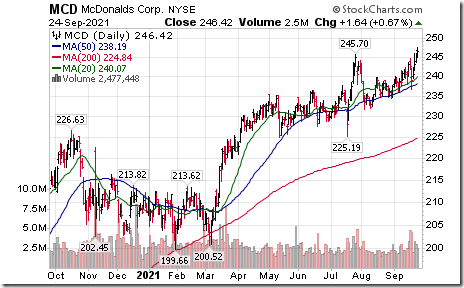
McDonald’s $MCD a Dow Jones Industrial Average stock moved above $247.05 to an all-time high extending an intermediate uptrend.
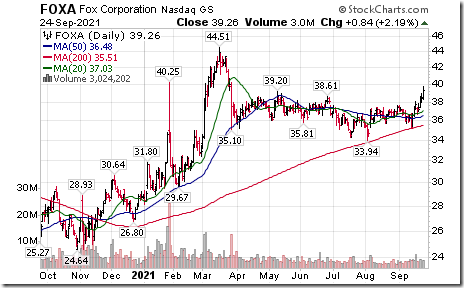
Fox $FOXA a NASDAQ 100 stock moved above $39.20 resuming an intermediate uptrend.
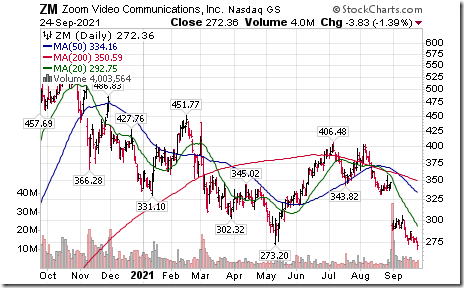
Zoom $ZM a NASDAQ 100 stock moved below $273.20 extending an intermediate downtrend.
S&P 500 Momentum Barometers
The intermediate term Barometer slipped 0.40 to 50.10 on Friday, but gained 6.21 last week to 50.10. It briefly changed from Neutral to Oversold on a move below 40.00, but recovered by the end of the week to above 40.00 and Neutral.
The long term Barometer added 0.40 on Friday and 2.81 last week to 74.55. It remained Overbought.
TSX Momentum Barometers
The intermediate term Barometer dropped 5.92 on Friday and 10.28 last week to 43.60. It briefly changed from Neutral to Oversold on a move below 40.00, but recovered by the end of the week to above 40.00 and a Neutral rating.
The long term Barometer eased 1.74 on Friday and slipped 3.50 last week to 64.46. It remains Overbought and trending down.
Disclaimer: Seasonality and technical ratings offered in this report and at
www.equityclock.com are for information only. They should not be considered as advice to purchase or to sell mentioned securities. Data offered in this report is believed to be accurate, but is not guaranteed
This post was originally publised at Vialoux's Tech Talk.


