by Don Vialoux, EquityClock.com
Technical Notes released yesterday at
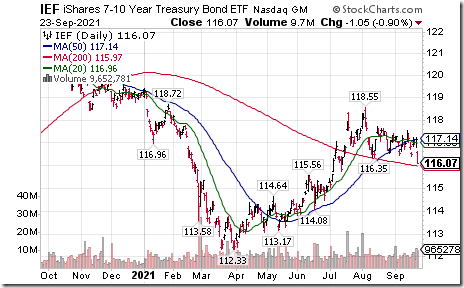
7-10 year Treasury Bond iShares $IEF moved below $116.35 setting an intermediate downtrend.
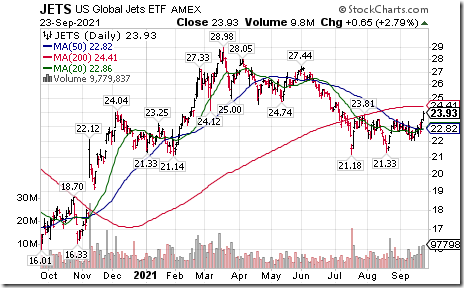
U.S. Global Jets ETF $JETS moved above $23.81 completing a double bottom pattern.
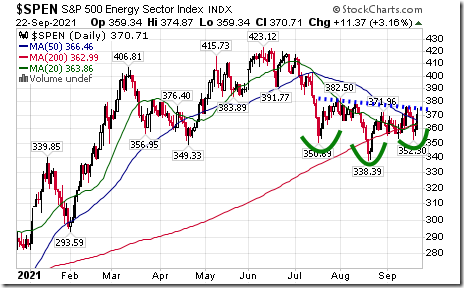
The energy sector is holding firm, despite the recent weakness in the broader market, and there are two industries within the sector that present viable plays in our seasonal strategy. equityclock.com/2021/09/22/… $XLE $VDE $IYE $XOP
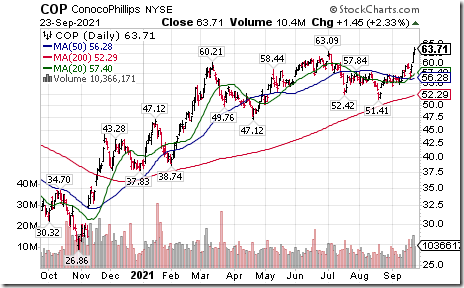
ConocoPhillips $COP an S&P 100 stock moved above $63.09 extending an intermediate uptrend.
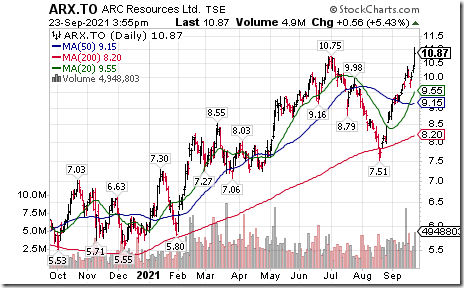
Canadian energy stocks also are responding to higher crude oil prices. ARC Resources $ARX.CA moved above $10.75 extending an intermediate uptrend
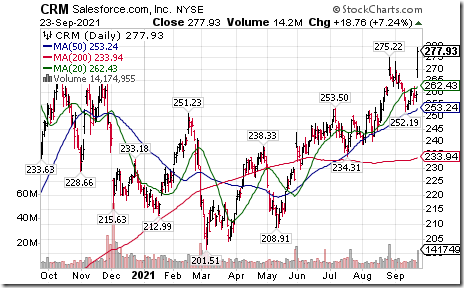
Salesforce $CRM a Dow Jones Industrial Average stock moved above $275.22 extending an intermediate uptrend.
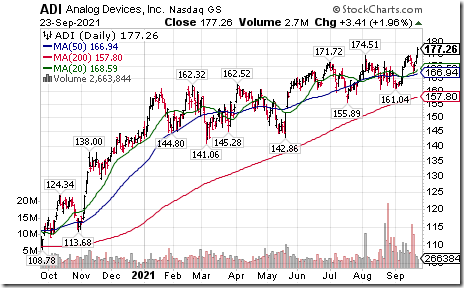
Analog Devices $ADI a NASDAQ 100 stock moved above $174.51 to an all-time high extending an intermediate uptrend.
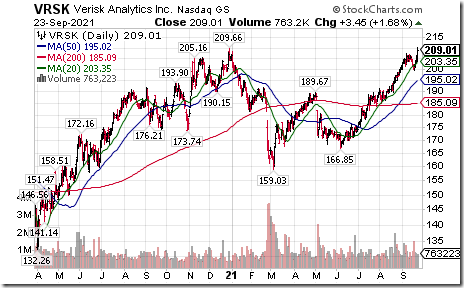
Varisk Analytics $VRSK a NASDAQ 100 stock moved above $209.66 to an all-time high extending an intermediate uptrend.
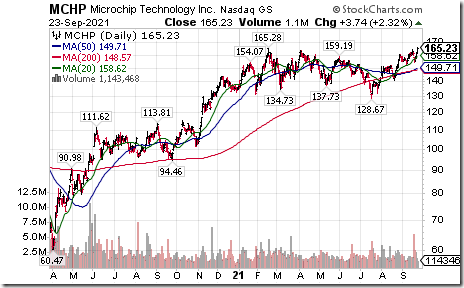
Microchip Technologies $MCHP a NASDAQ 100 stock moved above $165.28 to an all-time high extending an intermediate uptrend.
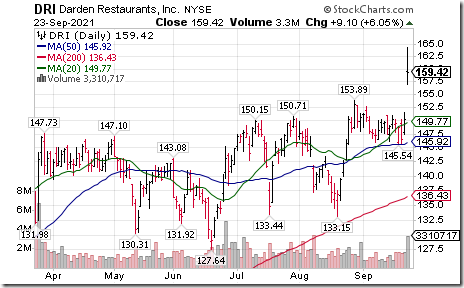
Darden Restaurants $DRI moved above $153.89 to an all-time high after reporting higher than consensus quarterly results. The company also offered positive guidance.
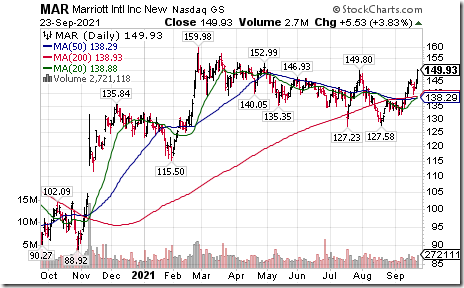
Marriot $MAR a NASDAQ 100 stock moved above $149.80 resuming an intermediate uptrend.
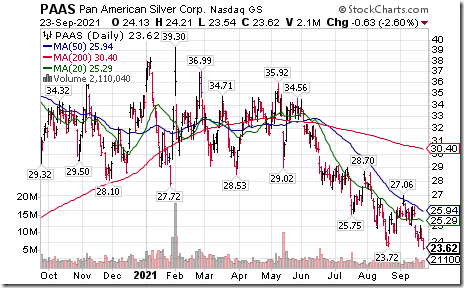
Silver stocks and related ETF $SIL are responding to lower silver prices. Pan American Silver $PAAS moved below $23.72 extend an intermediate downtrend.
Trader’s Corner
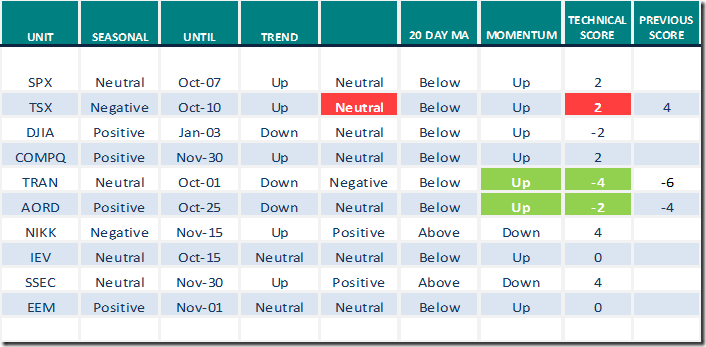
Equity Indices and Related ETFs
Daily Seasonal/Technical Equity Trends for September 23rd 2021
Green: Increase from previous day
Red: Decrease from previous day
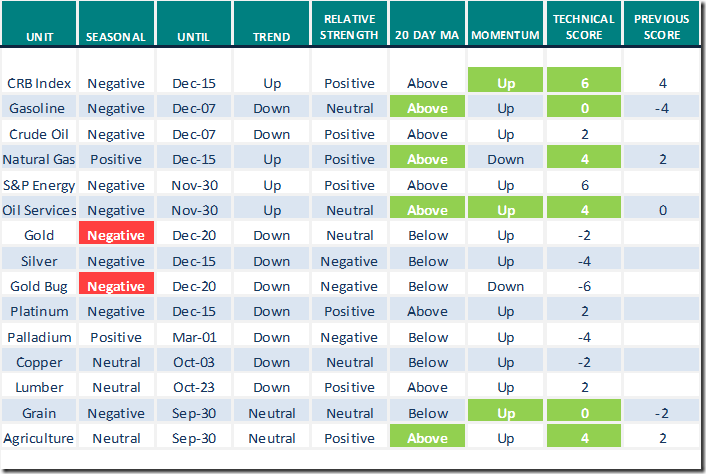
Commodities
Daily Seasonal/Technical Commodities Trends for September 23rd 2021
Green: Increase from previous day
Red: Decrease from previous day
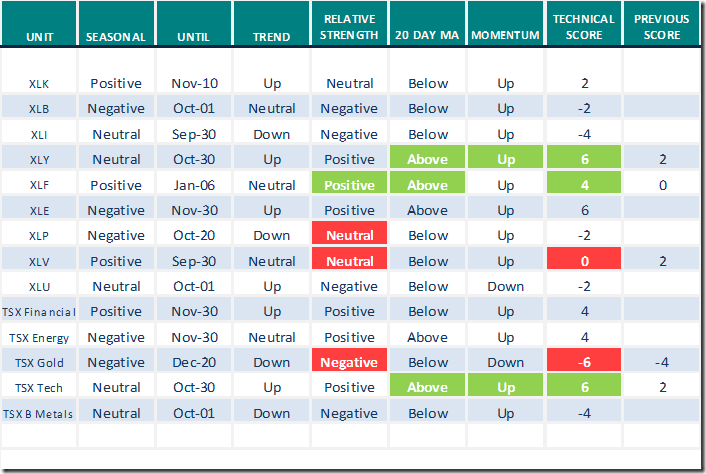
Sectors
Daily Seasonal/Technical Sector Trends for September 23rd 2021
Green: Increase from previous day
Red: Decrease from previous day
All seasonality ratings are based on performance relative to the S&P 500 Index
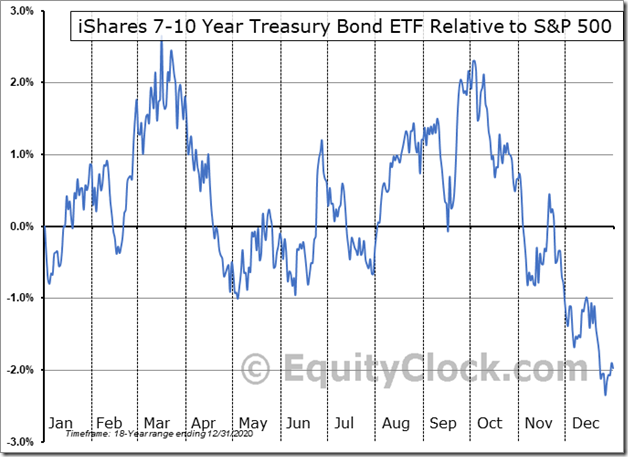
Seasonality Chart of the Day from www.EquityClock.com
7-10 year Treasury Bond iShares have a history of peaking relative to the S&P 500 Index at this time of year.
S&P 500 Momentum Barometers
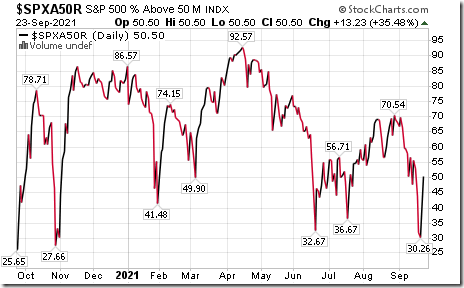
The intermediate term Barometer advanced 13.23 to 50.50 yesterday. It changed back from Oversold to Neutral on a move above 40.00.
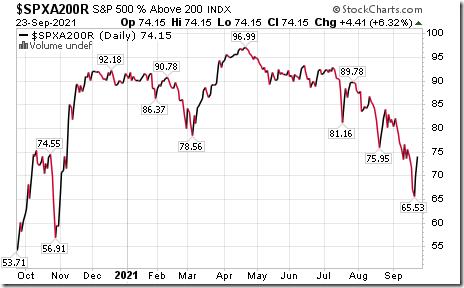
The long term Barometer gained 4.41 to 74.15 yesterday. It remains Overbought.
TSX Momentum Barometers
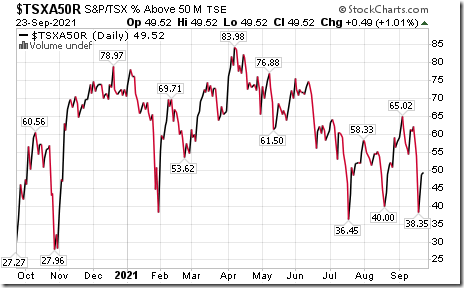
The intermediate term Barometer added 0.49 to 49.52 yesterday. It remains Neutral.
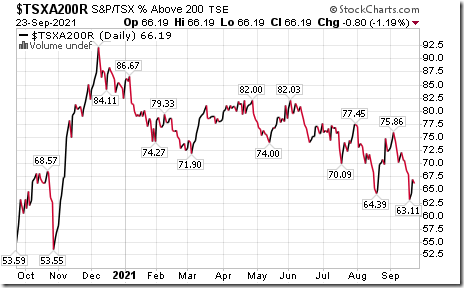
The long term Barometer slipped 0.80 to 66.19 yesterday. It remains Overbought.
Disclaimer: Seasonality and technical ratings offered in this report and at
www.equityclock.com are for information only. They should not be considered as advice to purchase or to sell mentioned securities. Data offered in this report is believed to be accurate, but is not guaranteed
This post was originally publised at Vialoux's Tech Talk.


