by Don Vialoux, EquityClock.com
Technical Notes released yesterday at
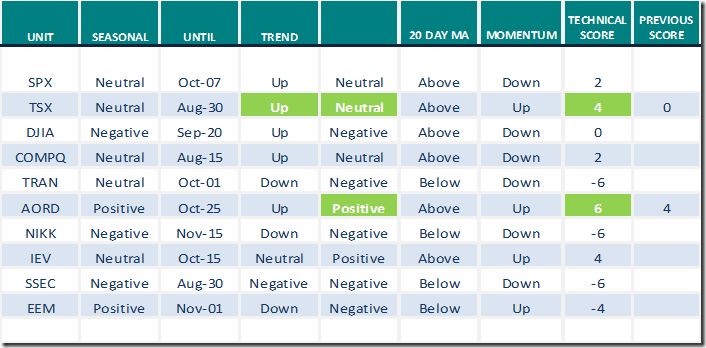
TSX Composite Index $TSX.CA advanced above its inter-day all-time high at 20,381.70 and its all-time closing high at $20,290.60
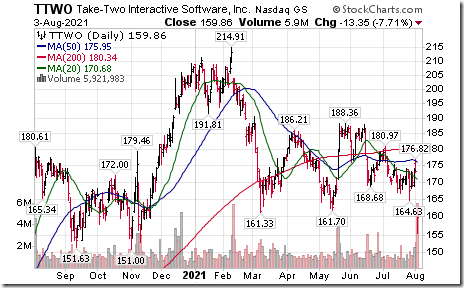
Take Two $TTWO a NASDAQ 100 stock moved below $161.70 and $161.30 setting an intermediate downtrend.
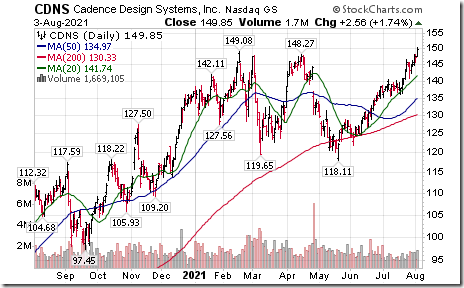
Cadence Design Systems $CDNS a NASDAQ 100 stock moved above $149.08 to an all-time high extending an intermediate uptrend.
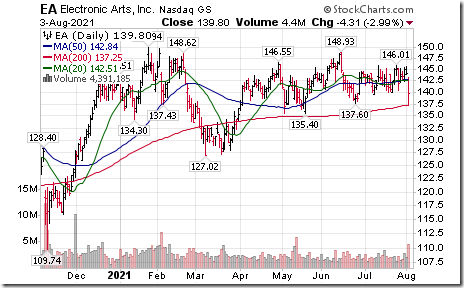
Electronic Arts $EA a NASDAQ 100 stock moved below $137.60 setting an intermediate downtrend.
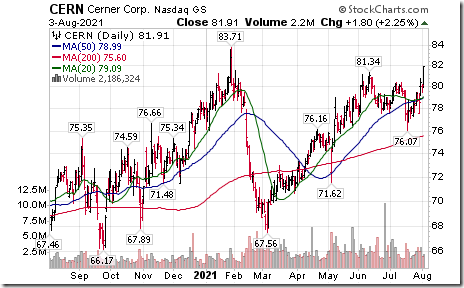
Cerner $CERN a NASDAQ 100 stock moved above $81.34 resuming an intermediate uptrend.
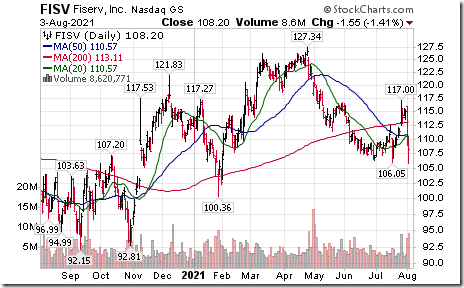
Fiserv $FISV a NASDAQ 100 stock moved below $106.05 extending an intermediate downtrend.
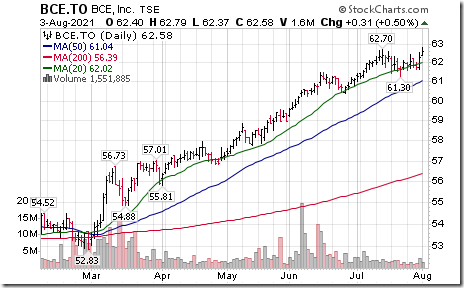
BCE Inc. $BCE.CA a TSX 60 stock moved above $62.70 to an all-time high extending an intermediate uptrend.
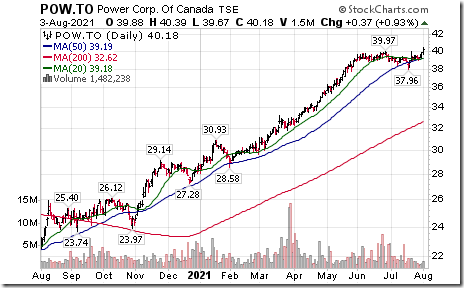
Power Corp. $POW.CA a TSX 60 stock moved above $39.97 to an all-time high extending an intermediate uptrend.
Trader’s Corner
Equity Indices and Related ETFs
Daily Seasonal/Technical Equity Trends for August 3rd 2021
Green: Increase from previous day
Red: Decrease from previous day
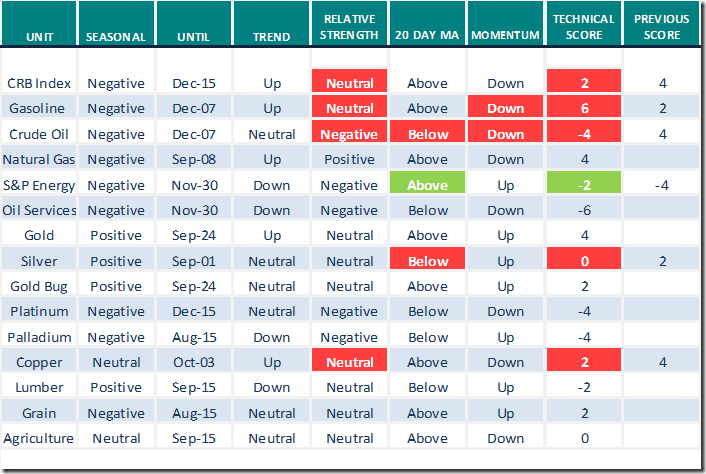
Commodities
Daily Seasonal/Technical Commodities Trends for August 3rd 2021
Green: Increase from previous day
Red: Decrease from previous day
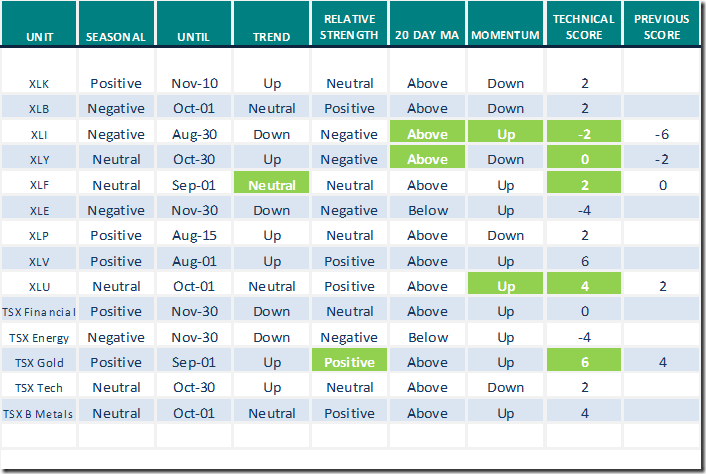
Sectors
Daily Seasonal/Technical Sector Trends for August 3rd 2021
Green: Increase from previous day
Red: Decrease from previous day
All seasonality ratings are based on performance relative to the S&P 500 Index
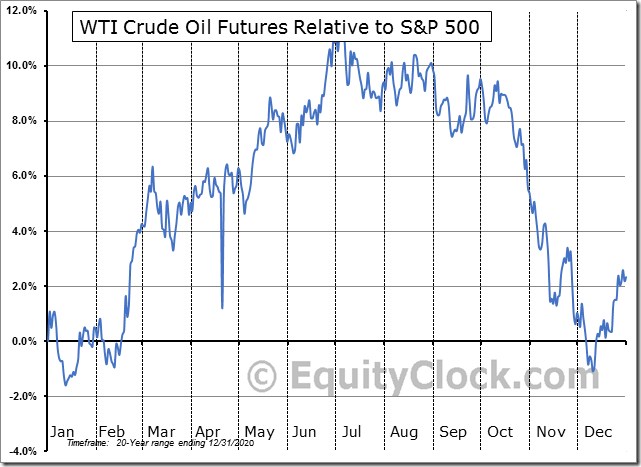
Seasonality Chart of the Day from www.EquityClock.com
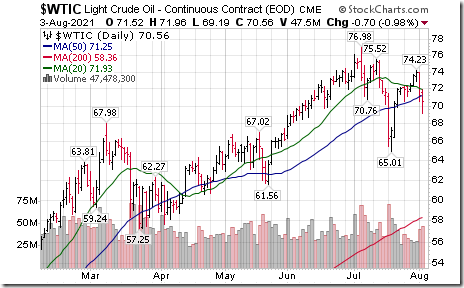
Crude oil futures have a history of peaking on a real and relative basis (relative to the S&P 500 Index) early in July and moving lower to the first week in December. This year, intermediate peak was reached at the first week of July. Additional technical deterioration appeared yesterday when relative strength changed to Negative and 20 and 50 day moving averages were broken.
S&P 500 Momentum Barometers
The intermediate term Barometer added 5.41 to 60.92 yesterday. It changed from Neutral to Overbought on a move above 60.00.
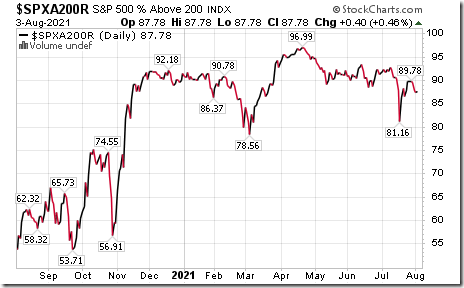
The long term Barometer added 0.40 to 87.78 yesterday. It remains Extremely Overbought.
TSX Momentum Barometers
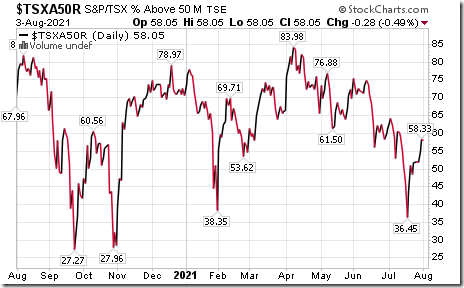
The intermediate term Barometer slipped 0.28 to 58.05 yesterday. It remains Neutral.
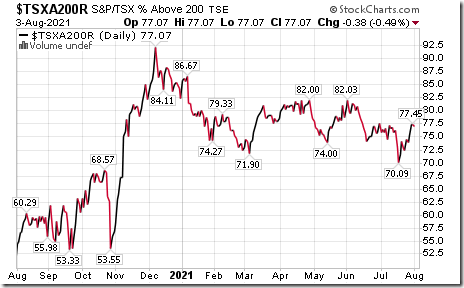
The long term Barometer slipped 0.38 to 77.07 yesterday. It remains Overbought.
Disclaimer: Seasonality and technical ratings offered in this report and at
www.equityclock.com are for information only. They should not be considered as advice to purchase or to sell mentioned securities. Data offered in this report is believed to be accurate, but is not guaranteed
This post was originally publised at Vialoux's Tech Talk.


