by Don Vialoux, EquityClock.com
Pre-opening Comments for Monday July 19th
U.S. equity index futures were lower this morning. S&P 500 futures were down 50 points in pre-opening trade. Weakness reflects drops by international equity market indices related to a surge in COVID 19 cases.
Yield on 10 year U.S. Treasuries fell to 1.2263 %
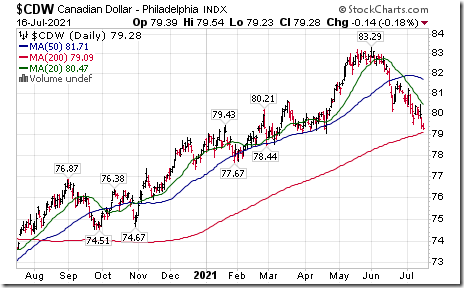
The Canadian Dollar dropped 0.93 to US78.35 cents in overnight trade.
Crude oil plunged $2.60 to $69.21 after OPEC + reached an agreement to increase production by 400,000 per month for each month until 2022.
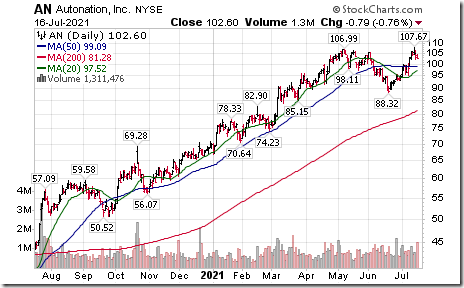
AutoNation added $1.11 to $103.71 after reporting higher than consensus second quarter revenues and earnings.
Alcoa (AA $32.95) is expected to open higher after Goldman Sachs upgraded the stock to “Conviction Buy” list.
EquityClock’s Daily Comment
Following is a link:
http://www.equityclock.com/2021/07/17/stock-market-outlook-for-july-19-2021/
The Bottom Line
North American and European indices were lower last week. Greatest influences on equity markets were possibility of a fourth wave by COVID 19 (negative) and continued expansion of distribution of a COVID 19 vaccine (positive).
Observations
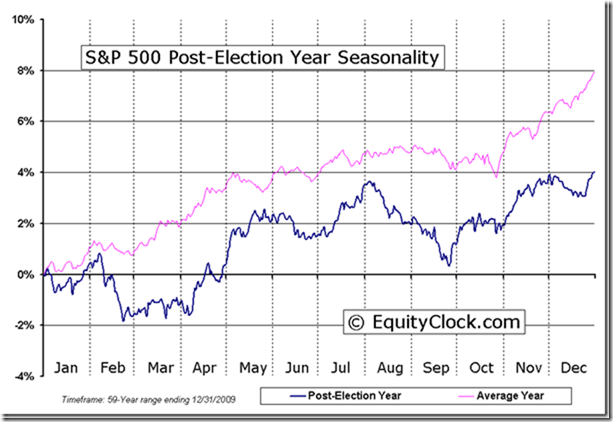
Seasonal influences for North American equity markets, that historically have been positive in the month of July (particularly in a Post-U.S. Presidential Election year), ended earlier than usual this July. Previously, strength in July during Post-U.S. Presidential Election years was related to a “honey moon” period when investors anticipated launch of a new mandate by the President. However, traders became “sellers on news” late last week despite exceptionally strong second quarter results that generally exceeded consensus revenue and earnings estimates. Short term technical indicators for most economic sensitive sectors (e.g. Materials, Consumer Discretionary, Financials, Energy and Industrials) and were notably weaker on both sides of the border.
Short term short term indicators for U.S. equity indices and sectors (20 day moving averages, short term momentum indicators) mostly moved lower last week.
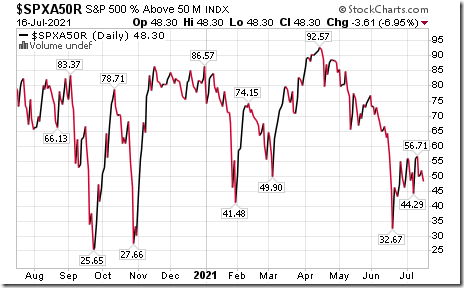
Intermediate term technical indicator for U.S. equity markets (e.g. Percent of S&P 500 stocks trading above their 50 day moving average) remained Neutral last week, but is trending down.. See Barometer charts at the end of this report.
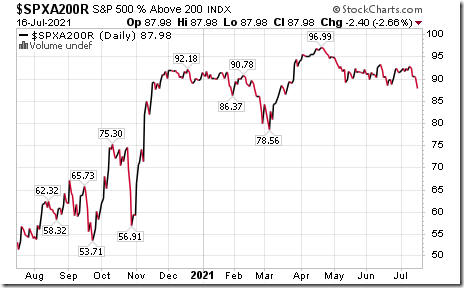
Long term technical indicator for U.S. equity markets (e.g. Percent of S&P 500 stocks trading above their 200 day moving average) moved slightly lower last week. It remained Extremely Overbought, but is trending down. See Barometer chart at the end of this report.
Short term momentum indicators for Canadian indices and sectors moved lower last week.
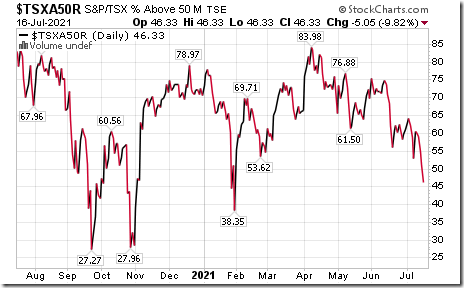
Intermediate term technical indicator for Canadian equity markets moved slightly lower last week. It changed from Overbought to Neutral and is trending down. See Barometer chart at the end of this report.
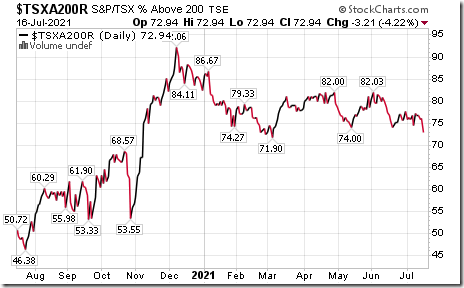
Long term technical indicator for Canadian equity markets (i.e. Percent of TSX stocks trading above their 200 day moving average) moved lower last week. It remained Overbought and is trending down. See Barometer charts at the end of this report.
Consensus estimates for earnings by S&P 500 companies continued to increase from our report last week. According to www.FactSet.com earnings in the second quarter on a year-over-year basis are expected to increase 69.3.0% (versus previous estimate last week at 64.0%) and revenues are expected to increase 20.2% (versus previous estimate at 19.7%). Earnings in the third quarter are expected to increase 24.2% (versus previous estimate at 23.7%) and revenues are expected to increase 12.7% (versus previous estimate at12.4%. Earnings in the fourth quarter are expected to increase 18.6% (versus previous estimate at 18.3%) and revenues are expected to increase 9.5% (versus previous estimate at 9.3%). Earnings for all of 2021 are expected to increase 36.7% (versus previous estimate at 35.6%) and revenues are expected to increase 12.8% (versus previous estimate at 12.6%). Earnings in 2022 are expected to increase 11.0% and revenues are expected to increase 6.8%.
Economic News This Week
U.S. June Housing Starts to be released at 8:30 AM EDT on Tuesday are expected to increase to 1.590 million units from 1.572 million units in May.
June Existing Home Sales to be released at 10:00 AM EDT on Thursday are expected to increase to 5.90 million units from 5.80 million units in May.
May Canadian Retail Sales to be released at 8:30 AM EDT on Friday are expected to drop 5.0% versus a decline of 5.7% in April. Excluding auto sales, May Canadian Retail Sales are expected to drop 5.0% versus a decline of 7.2% in April.
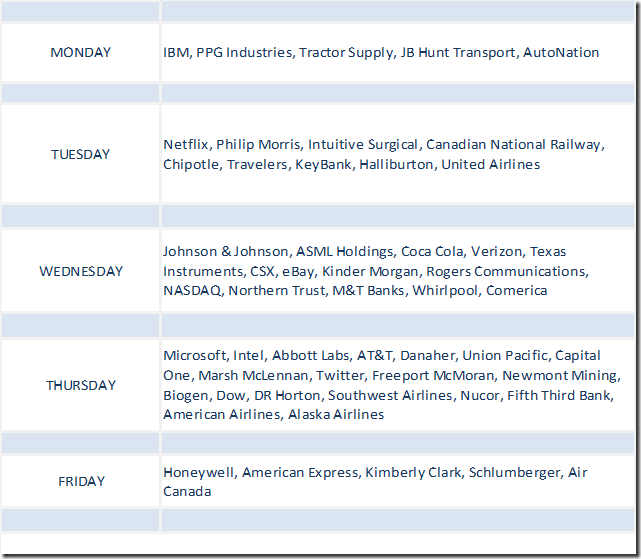
Selected Earnings Reports This Week
Frequency of U.S. earnings reports ramps up this week. Forty S&P 500 companies have reported to date. Another 79 S&P 500 companies (including eight Dow Jones Industrial Average companies) are scheduled to report this week. In Canada, reports from TSX 60 companies start to trickle in.
Trader’s Corner
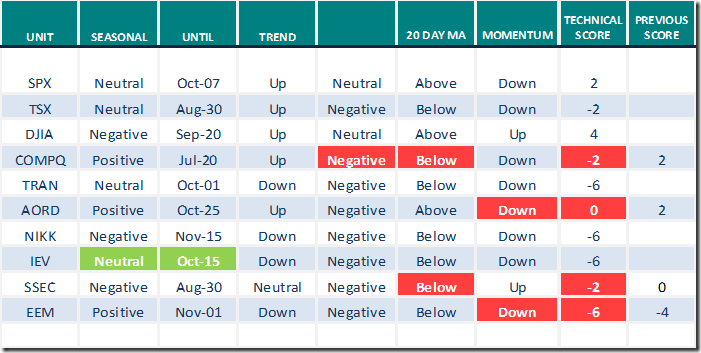
Equity Indices and Related ETFs
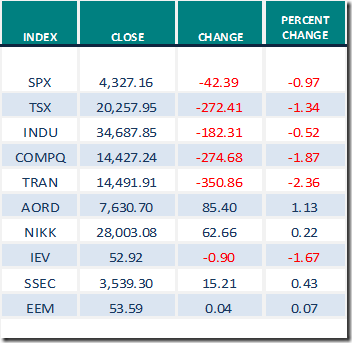
Daily Seasonal/Technical Equity Trends for July 16th 2021
Green: Increase from previous day
Red: Decrease from previous day
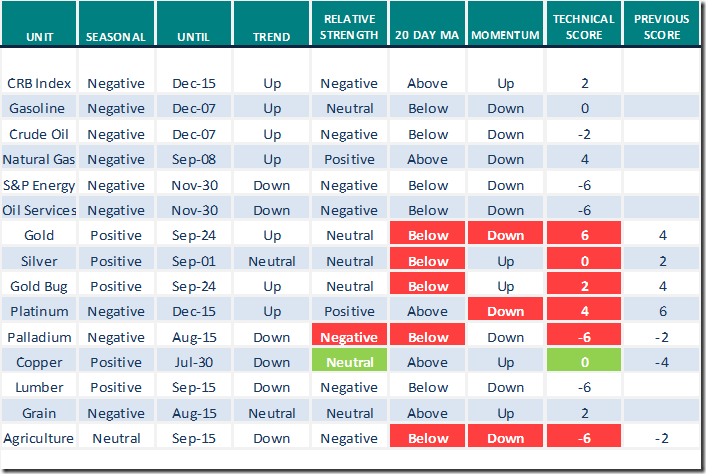
Commodities
Daily Seasonal/Technical Commodities Trends for July 16th 2021
Green: Increase from previous day
Red: Decrease from previous day
Sectors
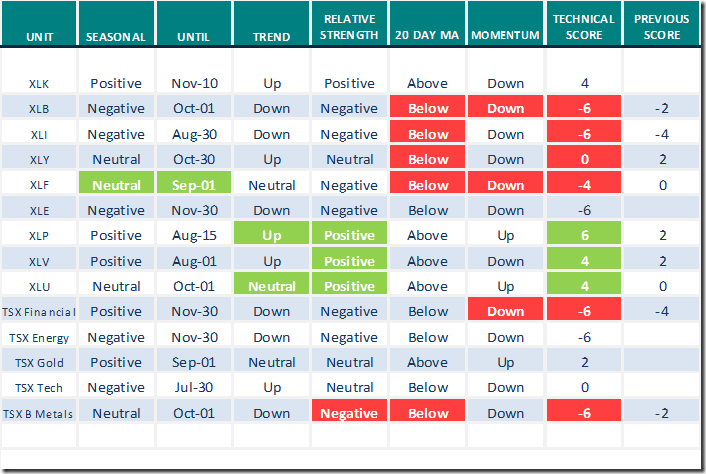
Daily Seasonal/Technical Sector Trends for July 16th 2021
Green: Increase from previous day
Red: Decrease from previous day
All seasonality ratings are based on performance relative to the S&P 500 Index
Technical Scores
Calculated as follows:
Intermediate Uptrend based on at least 20 trading days: Score 2
(Higher highs and higher lows)
Intermediate Neutral trend: Score 0
(Not up or down)
Intermediate Downtrend: Score -2
(Lower highs and lower lows)
Outperformance relative to the S&P 500 Index: Score: 2
Neutral Performance relative to the S&P 500 Index: 0
Underperformance relative to the S&P 500 Index: Score –2
Above 20 day moving average: Score 1
At 20 day moving average: Score: 0
Below 20 day moving average: –1
Up trending momentum indicators (Daily Stochastics, RSI and MACD): 1
Mixed momentum indicators: 0
Down trending momentum indicators: –1
Technical scores range from -6 to +6. Technical buy signals based on the above guidelines start when a security advances to at least 0.0, but preferably 2.0 or higher. Technical sell/short signals start when a security descends to 0, but preferably -2.0 or lower.
Long positions require maintaining a technical score of -2.0 or higher. Conversely, a short position requires maintaining a technical score of +2.0 or lower
Changes Last Week
Technical Notes for Friday at
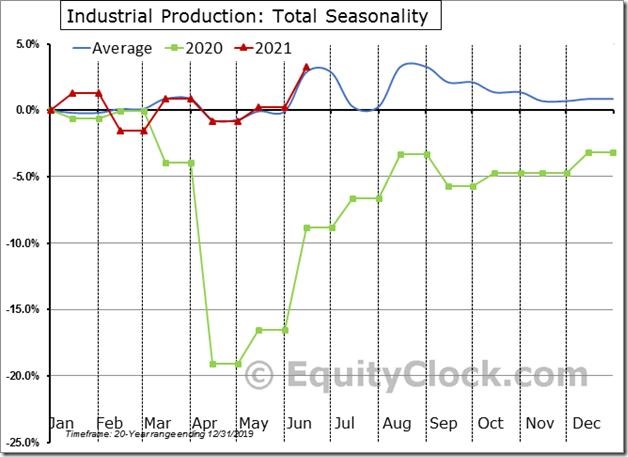
Industrial production, on aggregate, has softened, but manufacturers remain upbeat. Find out what this means in today’s report. equityclock.com/2021/07/15/… $SPX $XLI $XLB $STUDY #Economy #IndustrialProduction
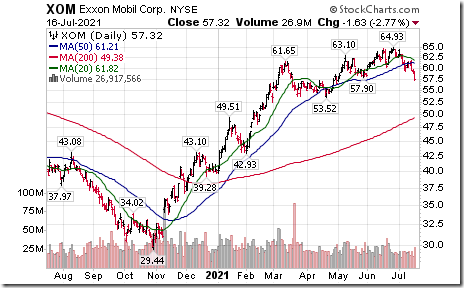
ExxonMobil $XOM a Dow Jones Industrial Average stock moved below intermediate support at $57.90.
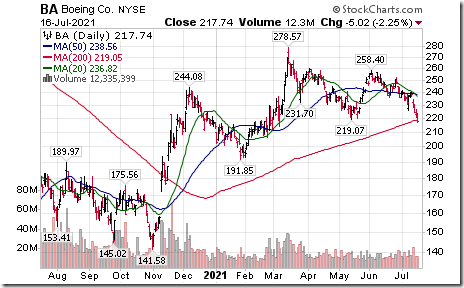
Boeing $BA a Dow Jones Industrial Average stock moved below $219.07 completing a double top pattern.
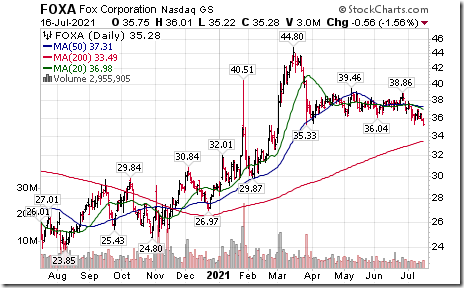
Fox Corp. $FOXA a NASDAQ 100 stock moved below $35.33 completing a double top pattern.
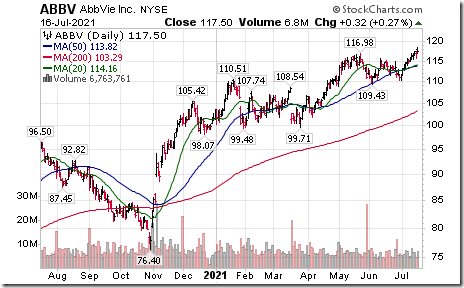
AbbVie $ABBV an S&P 100 stock moved above $116.98 to an all-time high extending an intermediate uptrend.
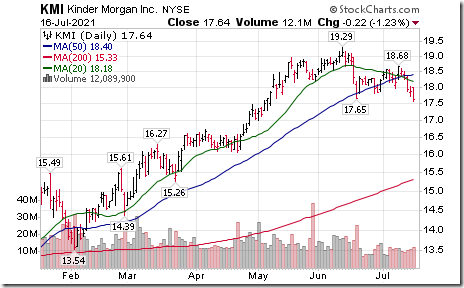
Kinder Morgan $KMI an S&P 100 stock moved below $17.65 completing a double top pattern.
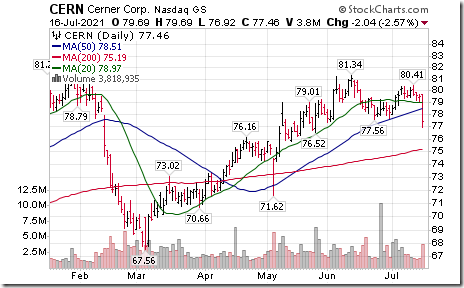
Cerner $CERN a NASDAQ 100 stock moved below $77.56 completing a double top pattern.
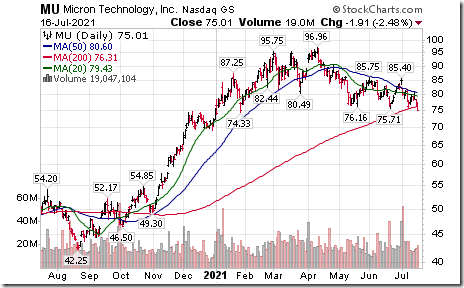
Micron $MU a NASDAQ 100 stock moved below $75.71 extending an intermediate downtrend.
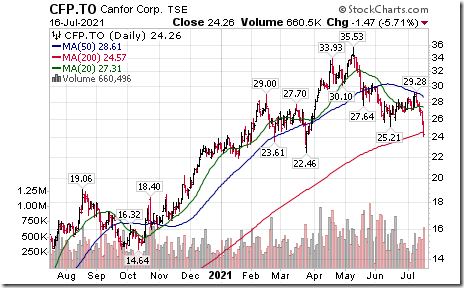
Canadian lumber stocks are responding to lower lumber prices. Interfor $IFP.CA moved below support at $27.27 and Canfor $CFP.CA moved below support at $25.21
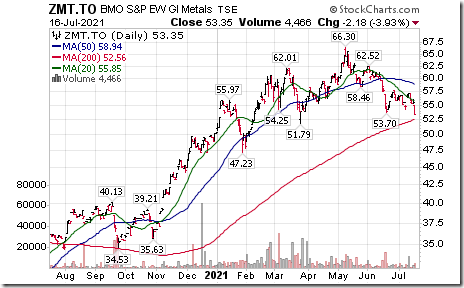
BMO Global Equal Weight Base Metals ETF $ZMT.CA moved below Cdn$53.70 extending an intermediate downtrend.
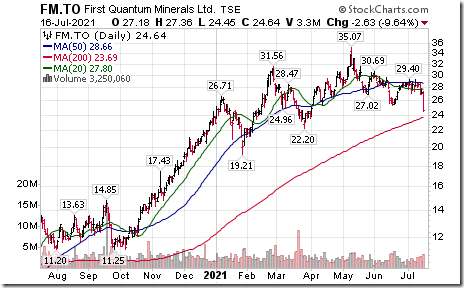
First Quantum Minerals $FM.CA a TSX 60 stock moved below $25.41 extending an intermediate downtrend.
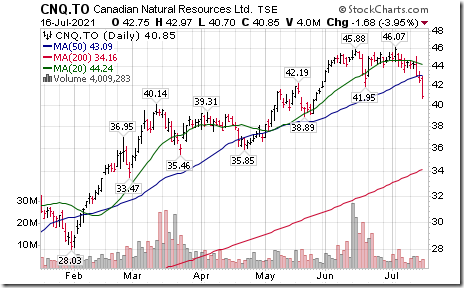
Canadian Natural Resources $CNQ.CA a TSX 60 stock moved below $41.95 completing a double top pattern.
Notes and videos from uncommon Sense Investor
Thank you to Mark Bunting and www.uncommonsenseinvestor.com for a link to the following report and video:
How to get Growth, Income and “Real” Assets from Booming ETFs
How to Get Growth, Income & "Real" Assets From Booming ETFs – Uncommon Sense Investor
Why Hedge Fund Manager Kass calls “Code Red” on “Chaotic Market”.
Why Hedge Fund Manager Kass Calls "Code Red" on "Chaotic" Market – Uncommon Sense Investor
Technical Scoop
Thank you to David Chapman and www.EnrichedInvesting.com for a link to their weekly comment:
S&P 500 Momentum Barometer
The intermediate Barometer dropped 3.61 on Friday and 7.81 last week. It remains Neutral and trending down.
The long term Barometer slipped 2.40 on Friday and 4.81 last week. It remains Extremely Overbought and trending down.
TSX Momentum Barometer
The intermediate Barometer dropped 5.05 on Friday and 14.12 last week. It changed from Overbought to Neutral on a drop below 60.00 and is trending down.
The long term Barometer dropped 3.21 on Friday and 4.33 last week. It remains Overbought and is trending down.
Disclaimer: Seasonality and technical ratings offered in this report and at
www.equityclock.com are for information only. They should not be considered as advice to purchase or to sell mentioned securities. Data offered in this report is believed to be accurate, but is not guaranteed
This post was originally publised at Vialoux's Tech Talk.


![clip_image002[1] clip_image002[1]](https://advisoranalyst.com/wp-content/uploads/2021/07/clip_image0021_thumb-4.png)
![clip_image004[1] clip_image004[1]](https://advisoranalyst.com/wp-content/uploads/2021/07/clip_image0041_thumb-2.png)
