by Don Vialoux, EquityClock.com
The Bottom Line
North American equity indices were mixed last week. Greatest influences on North American equity markets remain evidence of a possible third wave of the coronavirus (negative) and timing of distribution of a vaccine (positive).
Observations
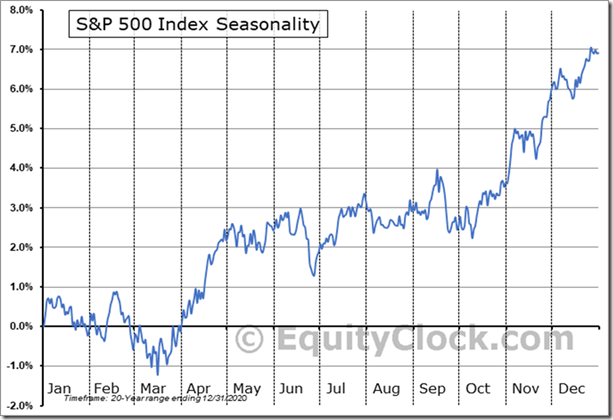
The S&P 500 Index recently entered into its strongest eight week period of seasonal strength for the year from mid-March to the first week in May.
The third distribution for Covid 19 relief cheques paid by the U.S. government to 330 million American citizens (except individuals earning more than $75,000 per year or $150,000 per couple) continued to flow into bank accounts. Value of the distribution is estimated at $415 billion out of the $1.9 trillion program passed by Congress and the President. The third distribution follows a distribution of $600 per person near the end of the year valued at $200 billion. At least some of these funds were diverted into equities. The third series of cheques from the U.S. government that started to be released in mid-March are expected to trigger additional purchases of equities, Exchange Traded Funds and mutual funds.
Short term short term indicators for U.S. equity indices, commodities and sectors (20 day moving averages, short term momentum indicators) slightly lower last week.
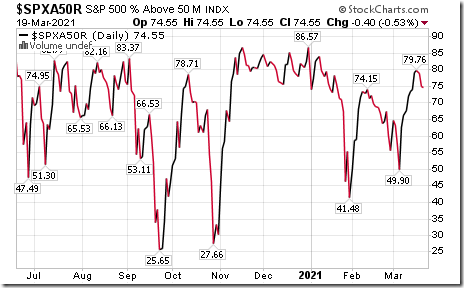
Intermediate term technical indicator for U.S. equity markets (e.g. Percent of S&P 500 stocks trading above their 50 day moving average) was virtually unchanged last week. It remained Overbought. See Barometer chart at the end of this report.
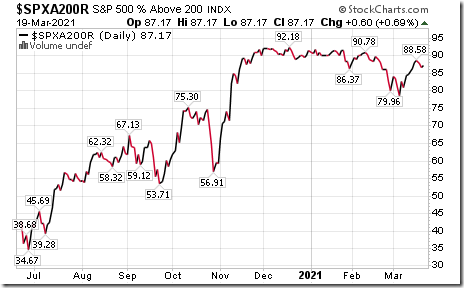
Long term technical indicator for U.S. equity markets (e.g. Percent of S&P 500 stocks trading above their 200 day moving average) also was virtually unchanged last week. It remained Extremely Overbought. See chart at the end of this report.
Short term momentum indicators for Canadian indices and sectors were virtually unchanged last week
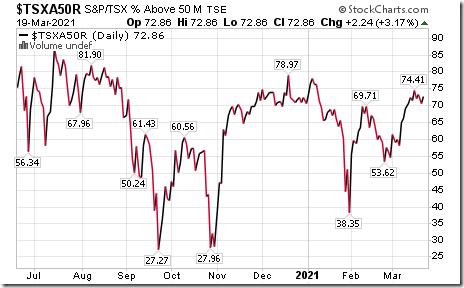
Medium term technical indicator for Canadian equity markets also was virtually unchanged last week. It remained Overbought. See Barometer chart at the end of this report.
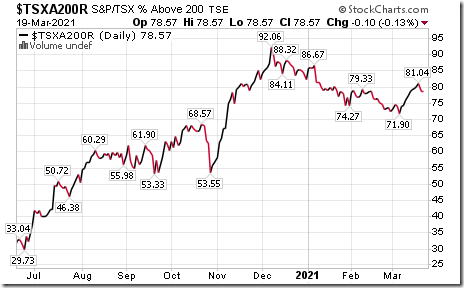
Long term technical indicator for Canadian equity markets (i.e. Percent of TSX stocks trading above their 200 day moving average) also was virtually unchanged last week. It remained Overbought. See Barometer chart at the end of this report.
Consensus estimates for earnings and revenues by S&P 500 companies turn strongly positive on a year-over-year basis particularly in the first and second quarters of 2021. Moreover, consensus estimates continue to increase. According to www.FactSet.com earnings in the first quarter of 2021 on a year-over-year basis are expected to increase 22.6% (versus previous estimate of 22.1% last week) and revenues are expected to increase 6.2%. Earnings in the second quarter are expected to increase 51.2% (versus previous estimate at 50.7%) and revenues are expected to increase 16.5% (versus previous estimate at 16.4%). Earnings in the third quarter are expected to increase 17.8% (versus previous estimate at 17.6%) and revenues are expected to increase 10.0% (versus previous estimate at 9.9%). Earnings in the fourth quarter are expected to increase 13.8% (versus previous estimate at 13.7%) and revenues are expected to increase 7.4% (versus previous estimate at 7.1%). Earnings for all of 2021 are expected to increase 24.9% (versus previous estimate at 24.6%) and revenues are expected to increase 9.5% (versus previous estimate at 9.4%).
Quarter end rebalancing between bonds and equities by institutional investors is expected to have a negative impact on U.S. equity prices and a positive impact on bond prices this week.
Economic News This Week
February Existing Homes to be released at 10:00 AM EDT on Monday are expected to slip to 6.49 million units from 6.69 million units in January.
February New Home Sales to be released at 10:00 AM EDT on Tuesday are expected to drop to 876,000 units from 927,000 units in January.
February Durable Goods Orders to be released at 8:30 AM EDT on Wednesday are expected to increase 0.8% versus a gain of 3.4% in January. Excluding aircraft orders, February Durable Goods Orders are expected to increase 0.6% versus a gain of 1.3% in January.
Federal Reserve Chairman Powell testimony to the Congress Joint Economic Committee is released at 10:00 AM EDT.
Actual estimate of U.S. annualized fourth quarter real GDP growth to be released at 8:30 AM EDT on Thursday is expected to remain unchanged at 4.1% versus a gain of 33.4% in the third quarter.
February Personal Income to be released at 8:30 AM EDT on Friday is expected to drop 7.2% versus a gain of 10.0% in January. February Personal Spending is expected to drop 0.7% versus a gain of 2.4% in January.
March Michigan Consumer Sentiment to be released at 10:00 AM EDT on Friday is expected to increase to 83.5 from 83.0 in February.
Selected Earnings Reports This Week
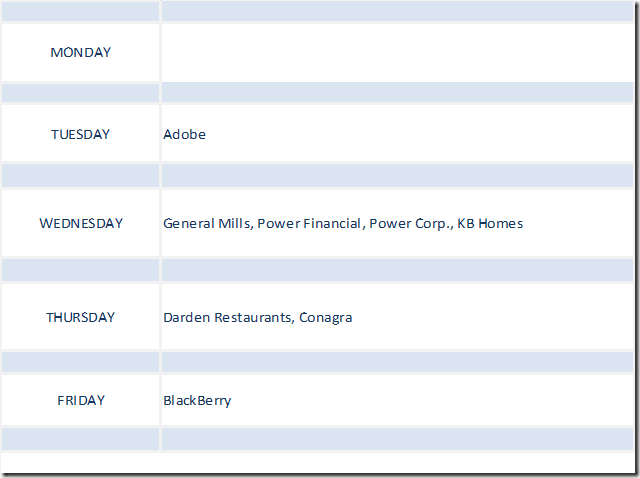
Only four S&P 500 companies are scheduled to report quarterly results this week.
Trader’s Corner
Equity Indices and Related ETFs
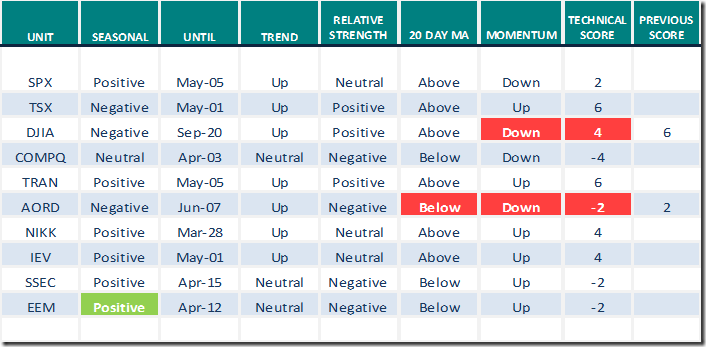
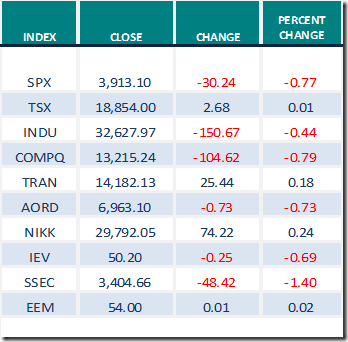
Daily Seasonal/Technical Equity Trends for March 19th 2021
Green: Increase from previous day
Red: Decrease from previous day
Commodities
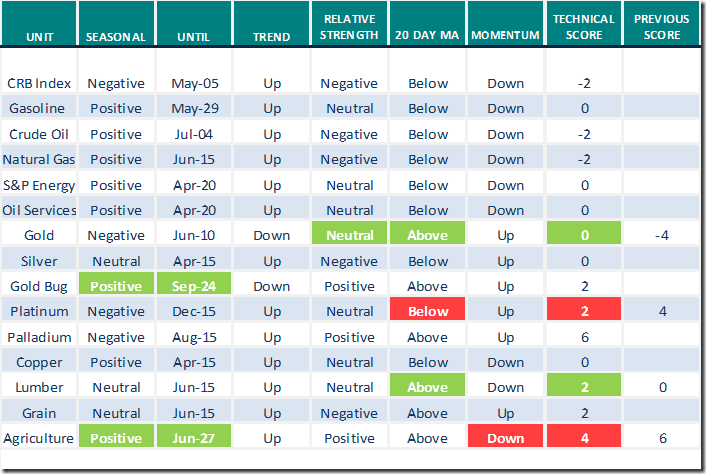
Daily Seasonal/Technical Commodities Trends for March 19th 2021
Green: Increase from previous day
Red: Decrease from previous day
Sectors
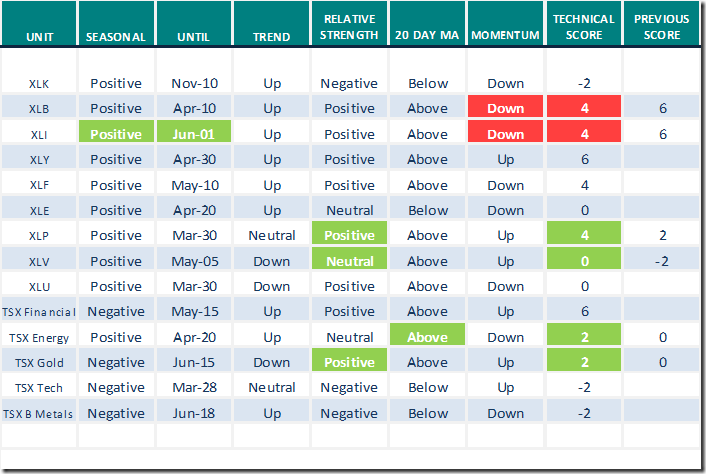
Daily Seasonal/Technical Sector Trends for March 19th 2021
Green: Increase from previous day
Red: Decrease from previous day
All seasonality ratings are based on performance relative to the S&P 500 Index
Technical Scores
Calculated as follows:
Intermediate Uptrend based on at least 20 trading days: Score 2
(Higher highs and higher lows)
Intermediate Neutral trend: Score 0
(Not up or down)
Intermediate Downtrend: Score -2
(Lower highs and lower lows)
Outperformance relative to the S&P 500 Index: Score: 2
Neutral Performance relative to the S&P 500 Index: 0
Underperformance relative to the S&P 500 Index: Score –2
Above 20 day moving average: Score 1
At 20 day moving average: Score: 0
Below 20 day moving average: –1
Up trending momentum indicators (Daily Stochastics, RSI and MACD): 1
Mixed momentum indicators: 0
Down trending momentum indicators: –1
Technical scores range from -6 to +6. Technical buy signals based on the above guidelines start when a security advances to at least 0.0, but preferably 2.0 or higher. Technical sell/short signals start when a security descends to 0, but preferably -2.0 or lower.
Long positions require maintaining a technical score of -2.0 or higher. Conversely, a short position requires maintaining a technical score of +2.0 or lower
Changes Last Week
Technical Notes for Friday March 19th
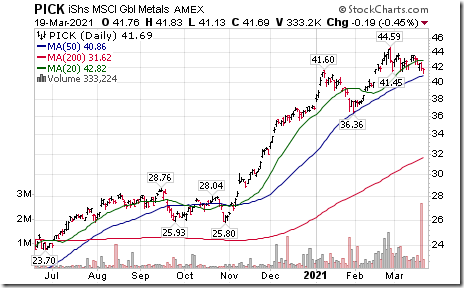
Global Base Metals iShares (PICK) moved below US$41.45 completing a double top pattern.
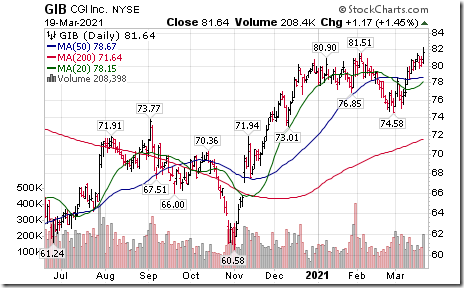
CGI Group (GIB), a TSX 60 stock moved above US$81.51 extending an intermediate uptrend.
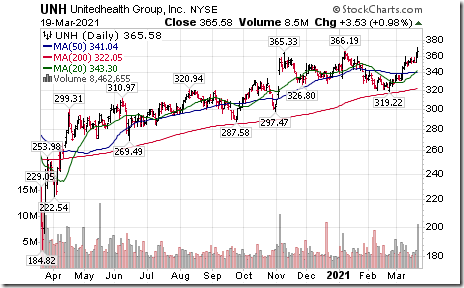
UnitedHealth Group (UNH), a Dow Jones Industrial Average stock moved above $366.19 to an all-time high extending an intermediate uptrend.
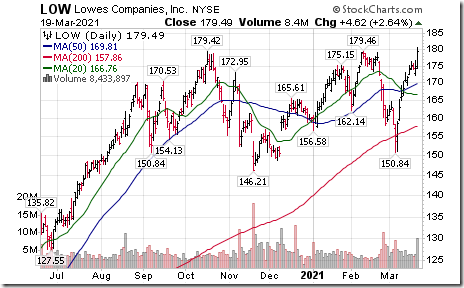
Lowe’s (LOW), an S&P 100 stock moved above $179.46 to an all-time high extending an intermediate uptrend.
Technical Scoop
Thank you to David Chapman and www.EnrichedInvesting.com for their weekly comment.
The Canadian Technician
Greg Schnell comments on “Real set ups in Real Estate”. Following is a link:
Real Set Ups in Real Estate | The Canadian Technician | StockCharts.com
Changes in Seasonality Ratings
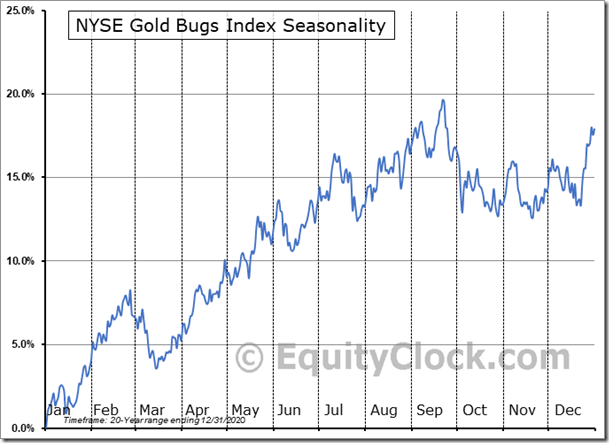
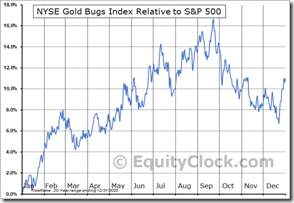
Gold Bug Index changed on a real and relative basis from Negative to Positive.
NYSE GOLD BUGS INDEX ($HUI) Seasonal Chart
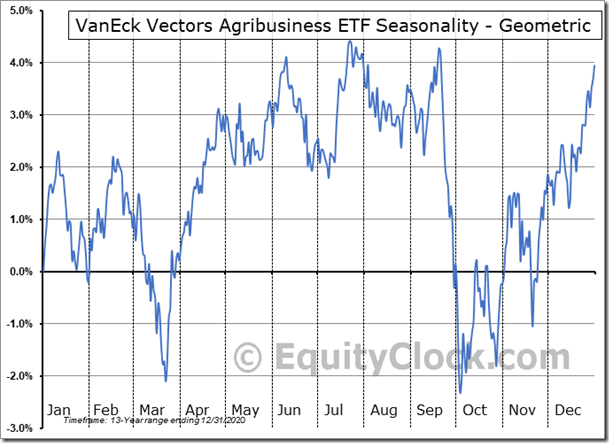
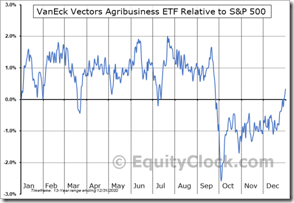
Agriculture ETFs (MOO in the U.S, COW on the TSX) changed from Neutral to Positive on a real and relative basis.
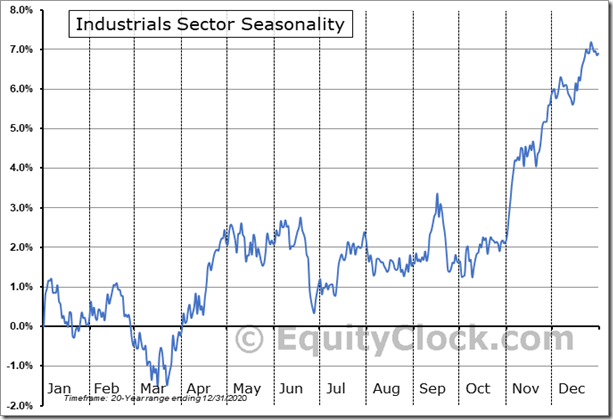
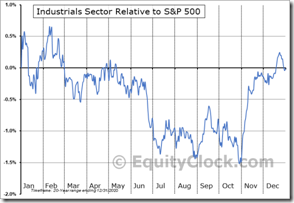
U.S Industrial ETFs changed from Neutral to Positive on a real and relative basis
Industrials Sector Seasonal Chart
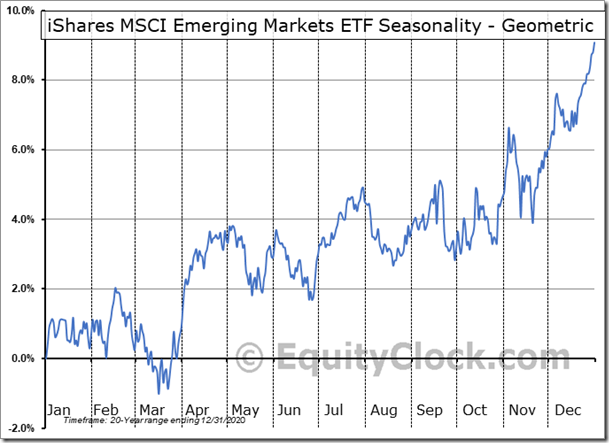
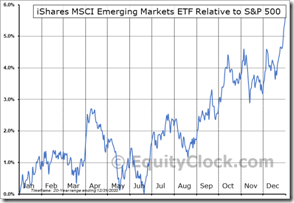
Emerging Markets changed from Neutral to Positive on a real and relative basis
S&P 500 Momentum Barometer
The intermediate Barometer slipped 0.40 on Friday but added 0.40 last week. It remains Overbought and has started to roll over.
The long term Barometer added 0.60 on Friday and gained 0.80 last week. It remains Extremely Overbought and has started to roll over.
TSX Momentum Barometer
The intermediate Barometer added 2.24 on Friday and 1.30 last week. It remains Overbought.
The long term Barometer slipped 0.10 on Friday and 0.58 last week to 78.57. It remains Overbought.
Disclaimer: Seasonality and technical ratings offered in this report and at
www.equityclock.com are for information only. They should not be considered as advice to purchase or to sell mentioned securities. Data offered in this report is believed to be accurate, but is not guaranteed
This post was originally publised at Vialoux's Tech Talk.


