


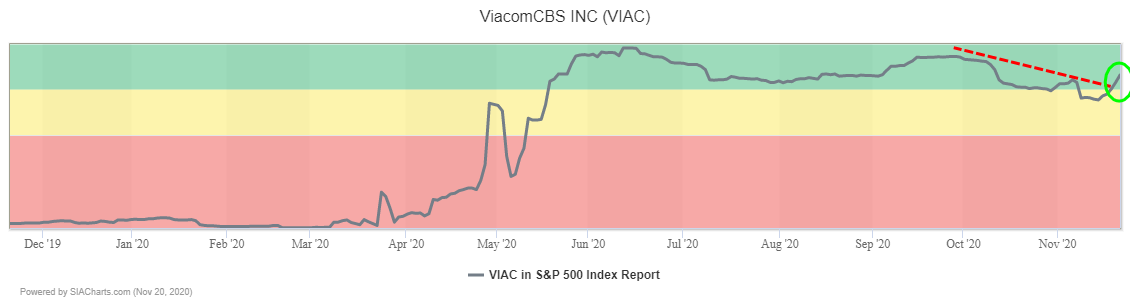
ViacomCBS (VIAC) recently to the Green Favored Zone in the SIA S&P 500 Index Report from a brief dip into the yellow zone. The shares continued to move up in the rankings on Friday, climbing another 20 spots.
ViacomCBS (VIAC) shares have been steadily recovering lost ground since bottoming out in March, establishing an upward trend of higher lows and completing a series of bullish Ascending Triangle pattern breakouts. Last week, the shares completed their most recent breakout, and have continued to climb, filling in an old gap and confirming ongoing accumulation.
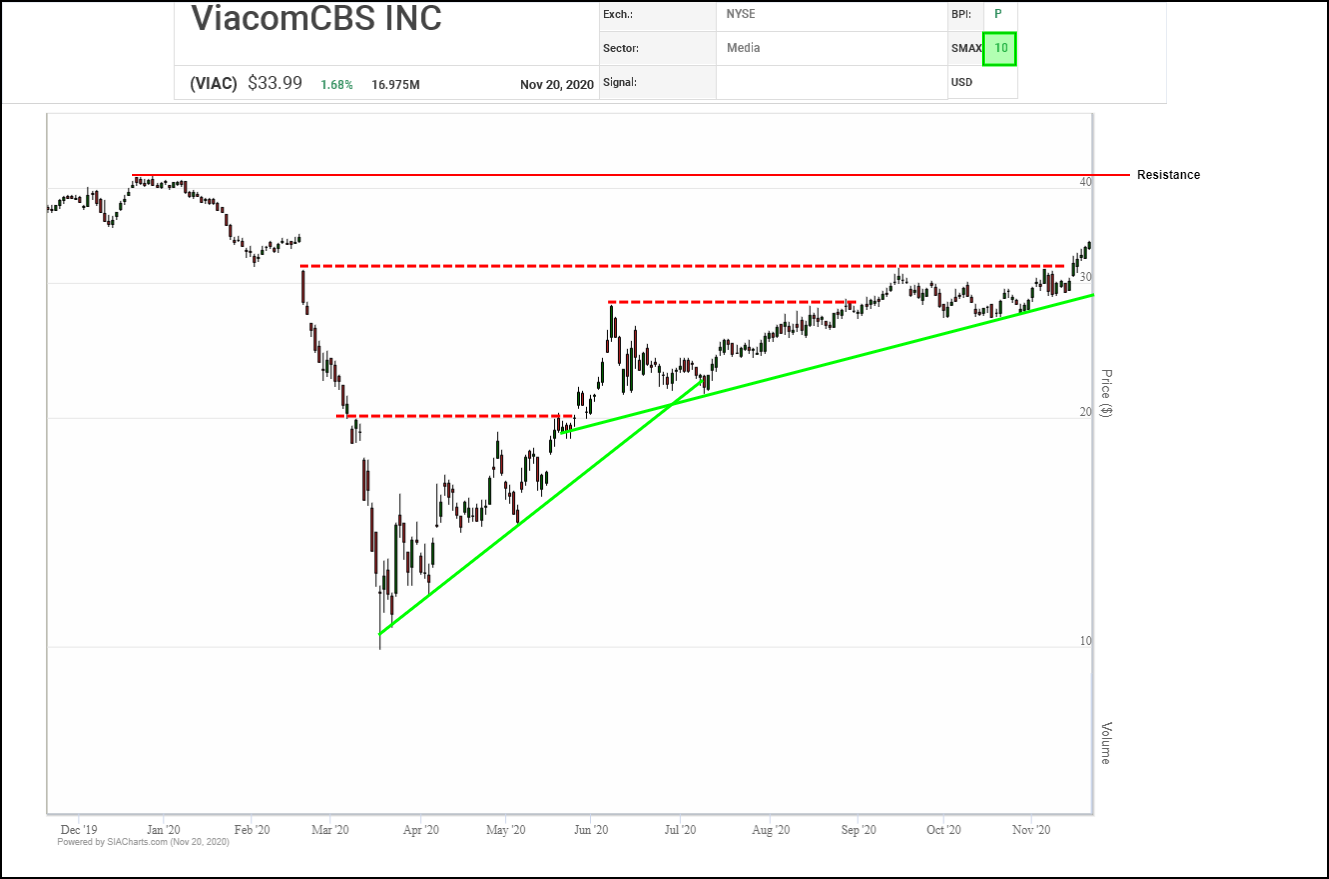
Next potential resistance appears in the $40.00 to $41.50 area where a round number, the 52-week high and a measured move converge. Initial support appears between the $31.50 breakout point and the $30.00 round number.
A major breakout is underway in ViacomCBS (VIAC) shares which not only completed another in a series of bullish pattern completions with a Double Top breakout last week, it also snapped a downtrend line, confirming that its recovery trend continues.
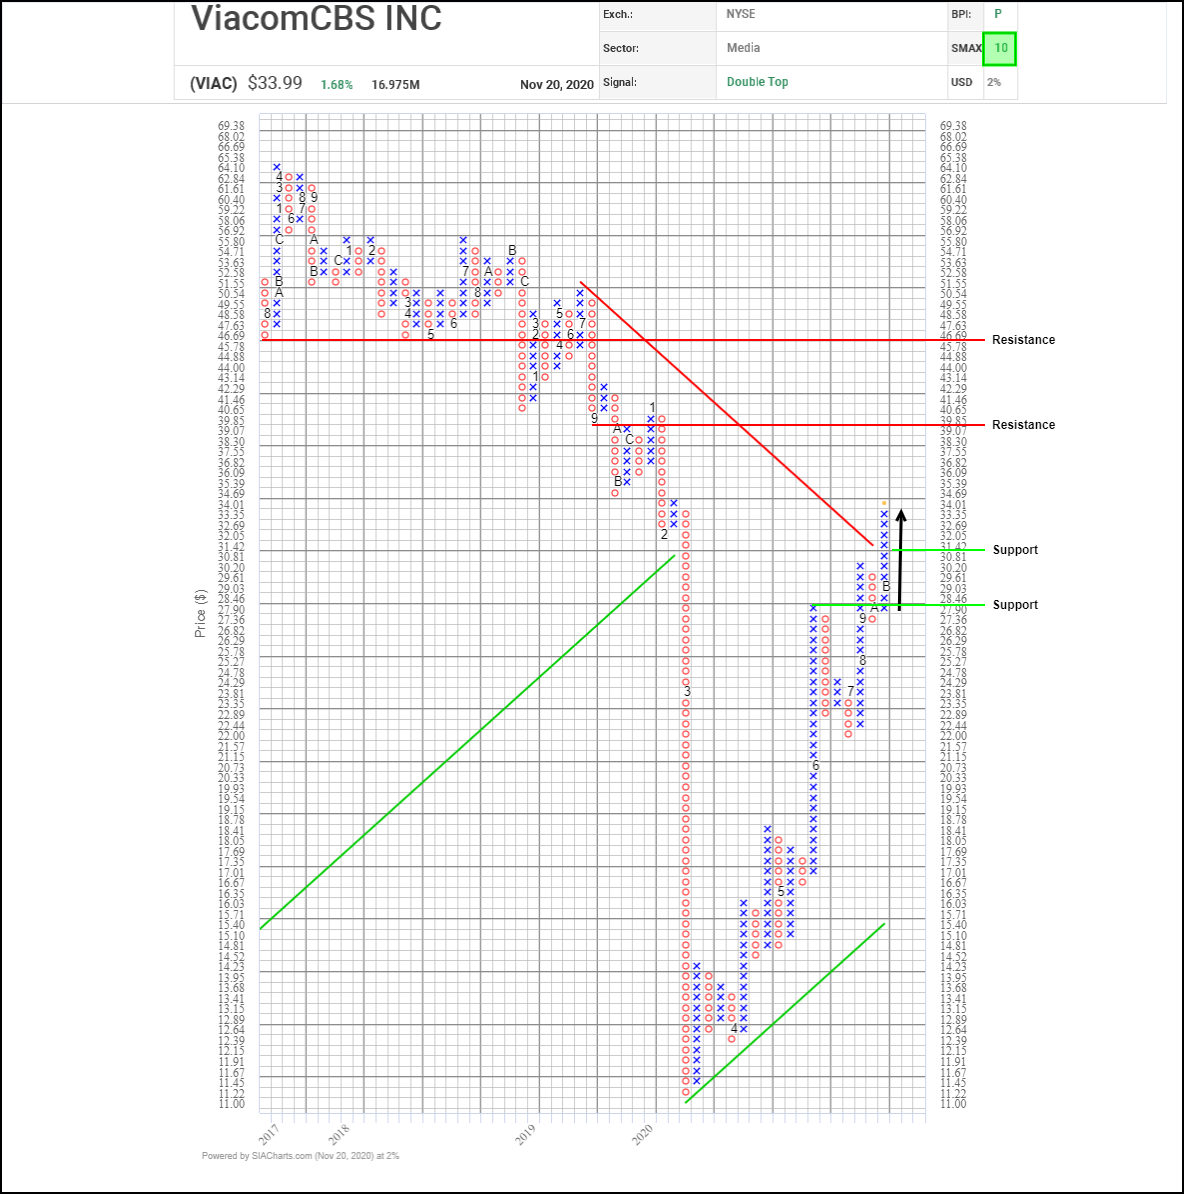
Initial upside resistance on trend appears near $40.00 where a round number, horizontal count, and a previous column low cluster together, followed by $46.70 where a vertical count and a previous support level converge. Initial support appears near $30.80 based on a 3-box reversal.
With its bullish SMAX score increasing to a perfect 10, VIAC is exhibiting near-term strength across the asset classes.
Disclaimer: SIACharts Inc. specifically represents that it does not give investment advice or advocate the purchase or sale of any security or investment whatsoever. This information has been prepared without regard to any particular investors investment objectives, financial situation, and needs. None of the information contained in this document constitutes an offer to sell or the solicitation of an offer to buy any security or other investment or an offer to provide investment services of any kind. As such, advisors and their clients should not act on any recommendation (express or implied) or information in this report without obtaining specific advice in relation to their accounts and should not rely on information herein as the primary basis for their investment decisions. Information contained herein is based on data obtained from recognized statistical services, issuer reports or communications, or other sources, believed to be reliable. SIACharts Inc. nor its third party content providers make any representations or warranties or take any responsibility as to the accuracy or completeness of any recommendation or information contained herein and shall not be liable for any errors, inaccuracies or delays in content, or for any actions taken in reliance thereon. Any statements nonfactual in nature constitute only current opinions, which are subject to change without notice.