


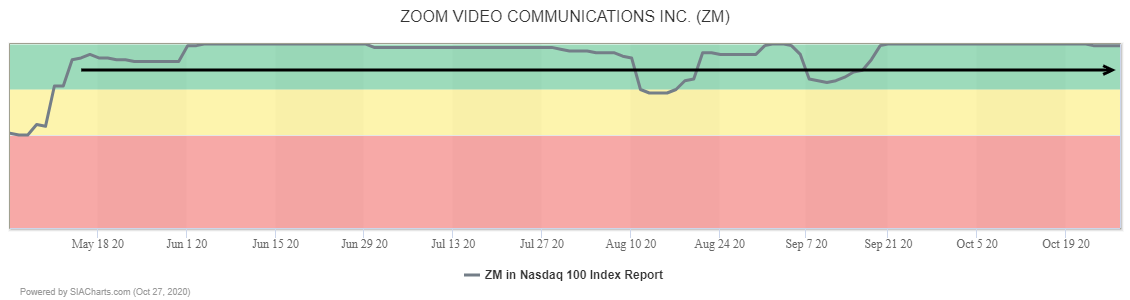
Zoom Video Communications (ZM) remains near the top of the Green Favored Zone in the SIA NASDAQ 100 Index, continuing to hold down 2nd place with a 4.1% gain yesterday.
This is a classic example of how resistance levels can reverse polarity and become support levels following a breakout. Earlier this month, Zoom Video Communications broke through the $500 round number to complete a bullish Ascending Triangle pattern and signal the start of a new upleg. After encountering resistance near $590, the shares dropped back but successfully retested $500 as new support and yesterday they turned upward once again, confirming the breakout and that the longer-term uptrend remains intact.
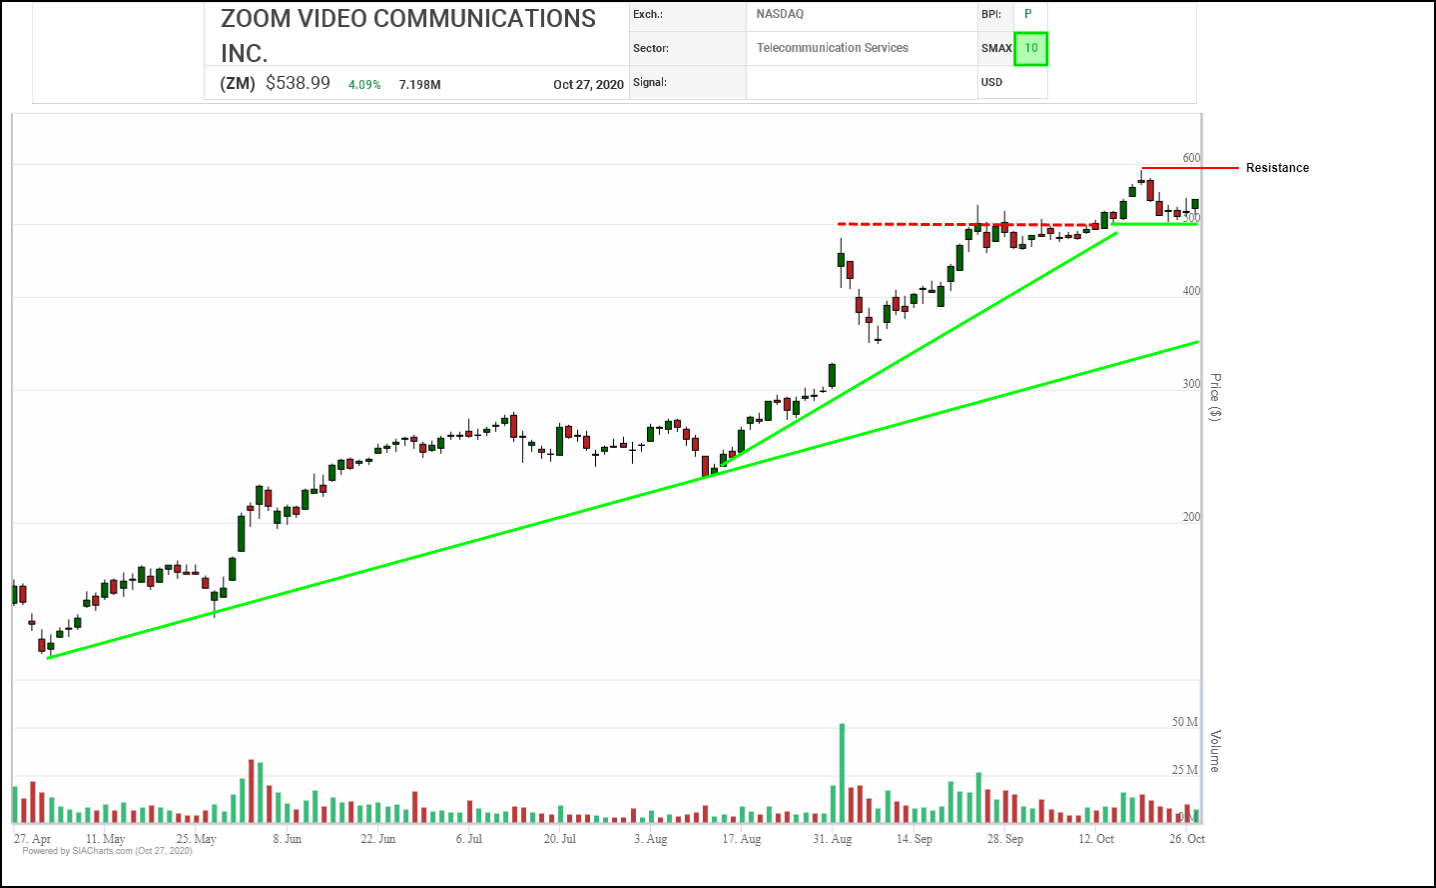
With $500 having been established as initial support, initial resistance appears at the previous high near $590, then the $650-680 zone based on measured moves.
Earlier this month, Zoom Video Communications (ZM) staged a major breakout, breaking through the $500 round number and completing a bullish Triple Top pattern. More recently, the shares have gone into sideways consolidation mode, staging a 4-box correction, but holding above their previous breakout point.
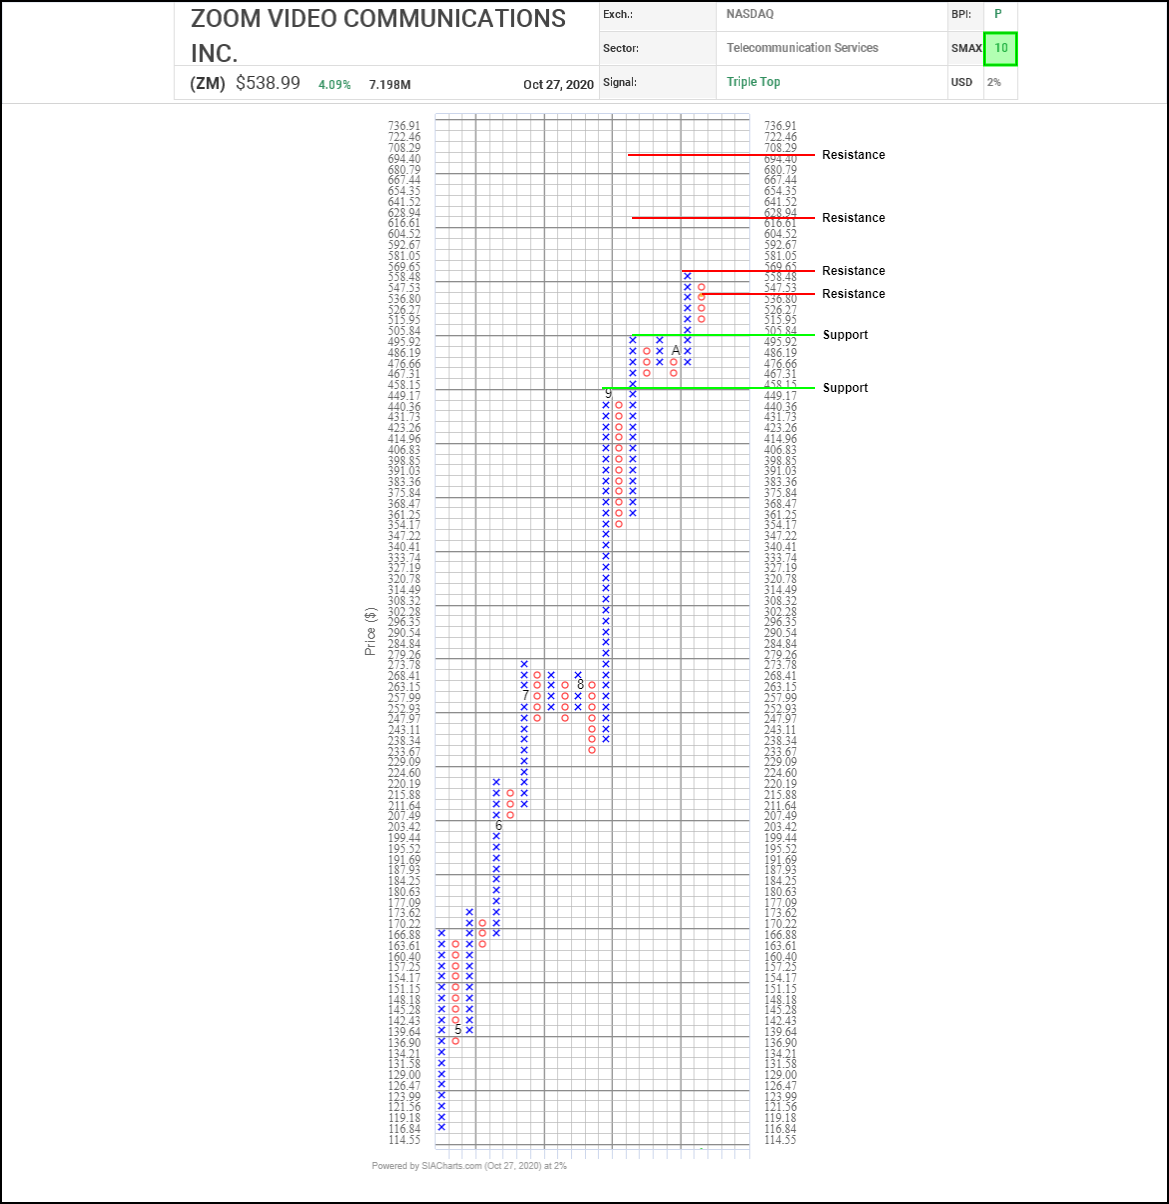
It would take a move up through $548 to complete a 3-box reversal to the upside and start a new X column. Potential upside resistance points on trend appear at the previous high near $570, then $630 ad $710 based on horizontal/vertical counts. The $495 to $505 area around the $500 round number and breakout point has become initial support.
With a perfect SMAX score of 10, ZM is exhibiting near-term strength against the asset classes.
Disclaimer: SIACharts Inc. specifically represents that it does not give investment advice or advocate the purchase or sale of any security or investment whatsoever. This information has been prepared without regard to any particular investors investment objectives, financial situation, and needs. None of the information contained in this document constitutes an offer to sell or the solicitation of an offer to buy any security or other investment or an offer to provide investment services of any kind. As such, advisors and their clients should not act on any recommendation (express or implied) or information in this report without obtaining specific advice in relation to their accounts and should not rely on information herein as the primary basis for their investment decisions. Information contained herein is based on data obtained from recognized statistical services, issuer reports or communications, or other sources, believed to be reliable. SIACharts Inc. nor its third party content providers make any representations or warranties or take any responsibility as to the accuracy or completeness of any recommendation or information contained herein and shall not be liable for any errors, inaccuracies or delays in content, or for any actions taken in reliance thereon. Any statements nonfactual in nature constitute only current opinions, which are subject to change without notice.