by Brian Levitt, Global Market Strategist, North America, Invesco Canada
Chuck Noland, Tom Hanks’ character in the movie Cast Away, may have perfectly captured the mood we need to bring to these challenging times, when he said, “I gotta keep breathing. Because tomorrow the sun will rise. Who knows what the tide could bring?”
In keeping with that positive, forward-looking mindset, we are initiating our Roadmap to Recovery: Start of the New Cycle dashboard. The dashboard highlights the indicators we will be watching to determine the efficacy of the policy responses to the coronavirus – medical, monetary, and fiscal – and to assess whether a new business and market cycle is emerging. In our view, the path to a new cycle would become evident from 6 key indicators.
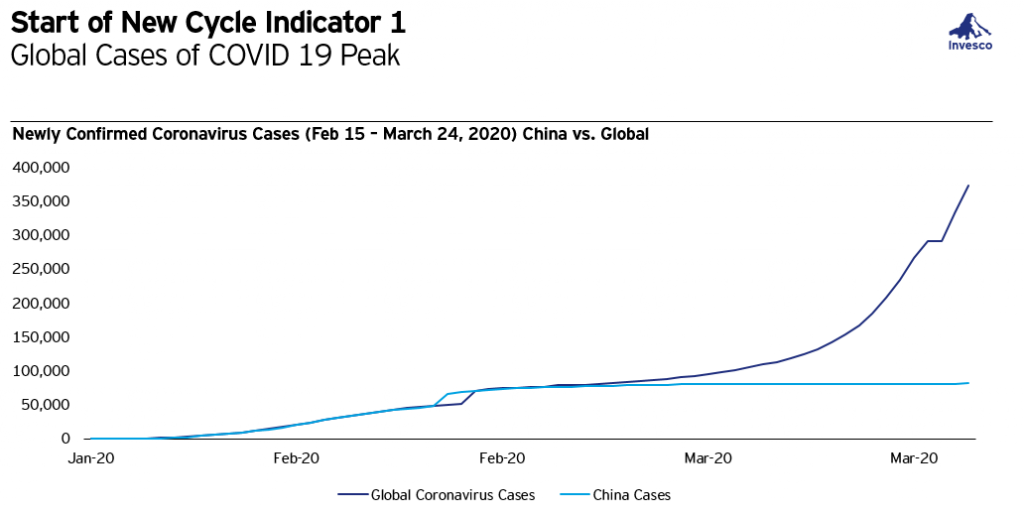
Source: Novel Coronavirus data is daily from December 31, 2019 to March 24, 2020. Source: WHO and FactSet Research Systems.
China’s number of news cases has peaked, but the number globally continues to increase. A bending in the curve of new cases will be a critical first step towards resuming economic activity.
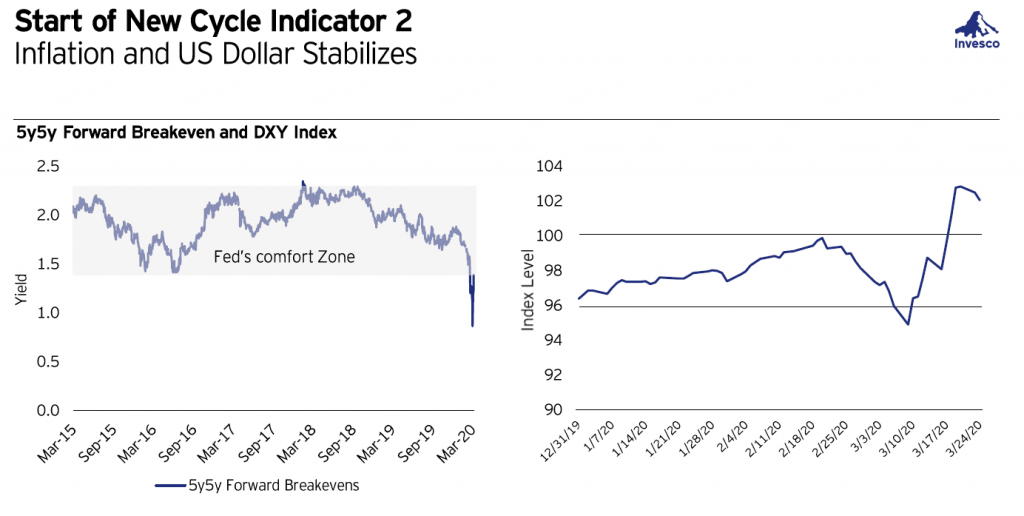
Source: Bloomberg, as of March 24, 2020. 5y5y Forward Breakeven is a measure of expected inflation (on average) over the five-year period that begins five years from today. The DXY Index is an index of the value of the United States dollar relative to a basket of foreign currencies, often referred to as a basket of U.S. trade partners’ currencies. Indexes are unmanaged and cannot be purchased directly by investors. Past performance does not guarantee future results.
In our view, deflation is the worst of all outcomes for risk assets because as prices fall then profits fall and then wages fall, and the vicious cycle begins anew. We are watching for signs that the massive policy support is helping to stabilize inflation expectations and ease the strength of the U.S. dollar.
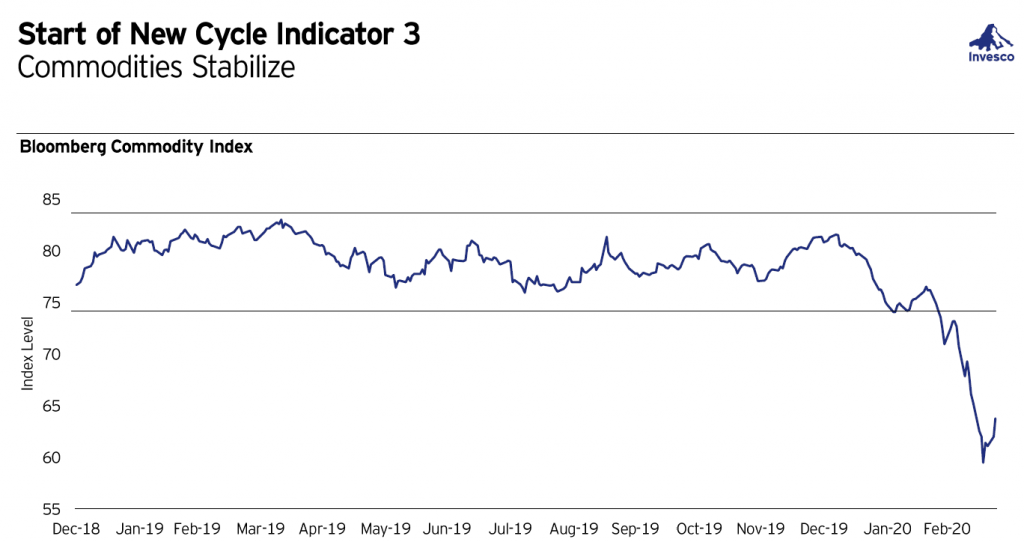
Source: FactSet Research Systems, as of March 24, 2020. The Bloomberg Commodity Index is calculated to reflect commodity price movements across a variety of commodities. Indexes are unmanaged and cannot be purchased directly by investors. Past performance does not guarantee future results.
We are watching commodity prices for signs that policy support is stabilizing the dollar and easing the pressure on the commodity complex as well as for an indication that economic activity is beginning to resume.
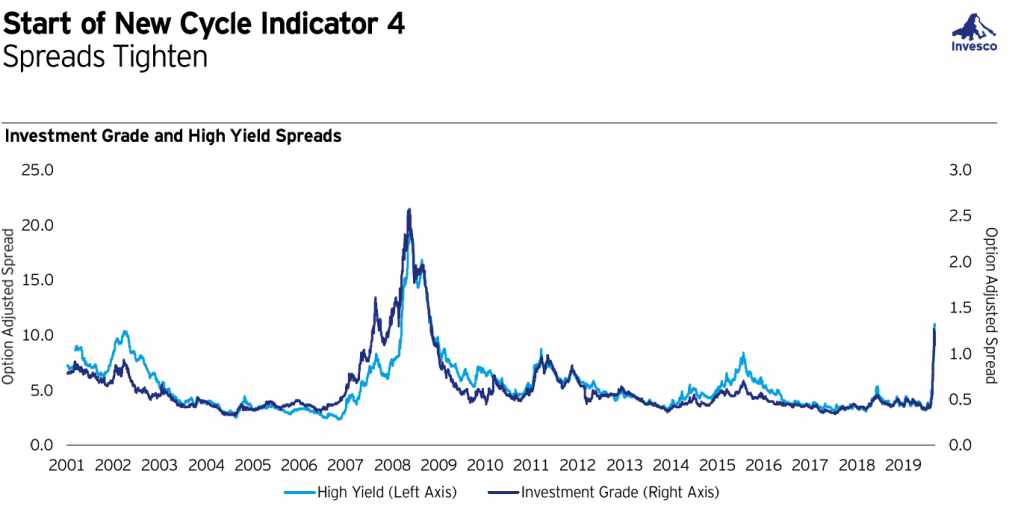
Sources: Barclays Live, 3/24/20. The Bloomberg Barclays U.S. Aggregate Bond Index is designed to measure the performance of investment grade bonds in the United States. The Bloomberg Barclays High Yield Index is designed to measure the performance of high yield (below investment grade) bonds in the United States. Option Adjusted Spread (OAS) is a measure of the spread (or difference in yield) between a bond index in this case and Treasuries of comparable maturities. Indexes are unmanaged and cannot be purchased directly by investors. Past performance does not guarantee future results.
The corporate bond market is often viewed as the “canary in the coal mine” for the global economy and the equity markets. True to form, spreads have widened significantly during this period of significant economic and financial market disruption. The Federal Reserve is providing significant support to the corporate bond market and the federal government is actively working to provide support to the nation’s businesses. We are watching for signs that conditions are easing, and corporate bond spreads are steadying.
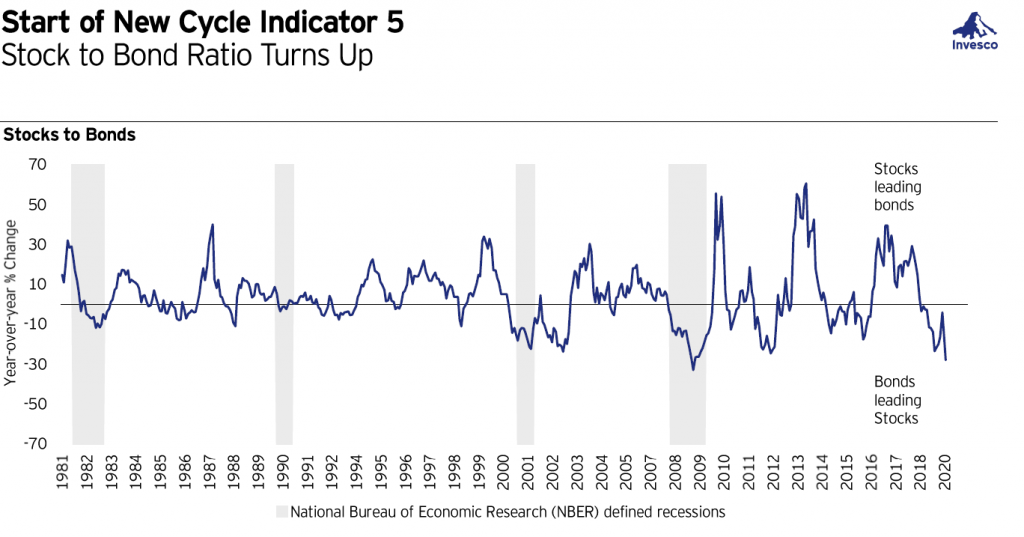
Source: Bloomberg, as of March 20, 2020. The bond market is represented by long-term Treasuries; the stock market, by the S&P 500. The S&P 500 Index is a market-capitalization-weighted index designed to measure large capitalization stocks in the United States. Past performance does not guarantee future results.
The bond market continues to do better than U.S. stocks. We think a turn in the stock to bond ratio would be a positive signal that investors and the market are beginning to price in a resumption in economic activity.
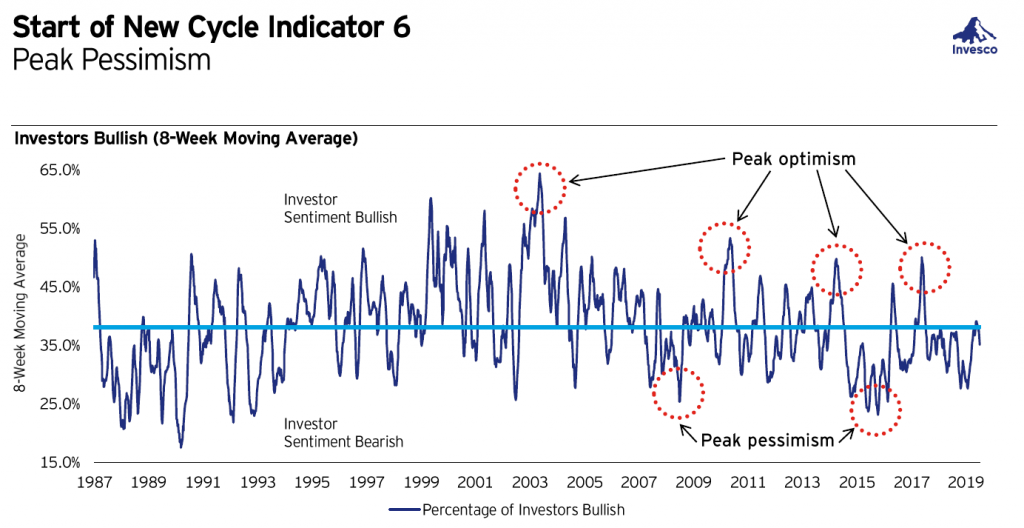
Source: Data represent what direction members feel the stock market will be in over the next 6 months. American Association of Individual Investors (AAII Survey), as of March 20, 2020.
Markets have been pessimistic overall, to varying degrees, since the contagion became global. There is no sign we have reach peaked pessimism yet, but a bottoming in equity allocation tends to be a positive sign for markets.
Conclusion: A positive note
On a positive note, we saw modest improvement amid a sizeable policy response on the monetary and fiscal side on March 24 that helped inflation expectations, the dollar, commodity prices, and credit spreads all start to move modestly in the right direction. While this isn’t an all clear signal, we will be watching closely for more signs of improvement from here.
We will be monitoring these indicators daily and will be sending out regular updates.
With additional commentary from Timothy Horsburgh, CFA, Investment Strategist, and Talley Léger, Senior Investment Strategist.
This post was first published at the official blog of Invesco Canada.


