by Russ Koesterich, CFA, Blackrock
The value drought persists. Large cap growth, measured by the Russell 1000 Growth Index, is beating value, measured by the Russell 1000 Value Index, by approximately 450 basis points (bps, or 4.5% points) year-to-date and by a similar amount during the past 12 months.
Growth’s recent out-performance conforms to the post-crisis norm. Focusing on price returns, since 2010 growth has outperformed value by an average of approximately 350 bps a year. The out-performance has not only been meaningful, it has been consistent. During the past five years value has only outperformed meaningfully on one occasion, 2016.
Not just about earnings
As others have noted, a large part of growth’s winning streak can be attributed to stellar earnings growth, particularly from technology companies. That said, multiple expansion, i.e. paying more for a dollar of earnings, has played a part as well. Since the 2011 market bottom, the trailing price-to-earnings (P/E) ratio for the Russell 1000 Growth Index is up roughly 65%. In contrast, the value index’s P/E ratio has expanded by a more modest 40%.
But while growth stocks are not particularly cheap, it is not obvious that they are expensive. Valuations are slightly below the long-term average. In other words, the fact that growth looks stretched relative to value is not a function of growth being particularly rich but value being very cheap.
For multiples to converge, the economy needs to get stronger
Growth’s premium to value can be partly explained by the economy. When investors are worried about economic growth, as they have been for much of the recovery, they tend to favor growth as a style. The reason: Even in a weak economy, growth companies can generate organic earnings growth.
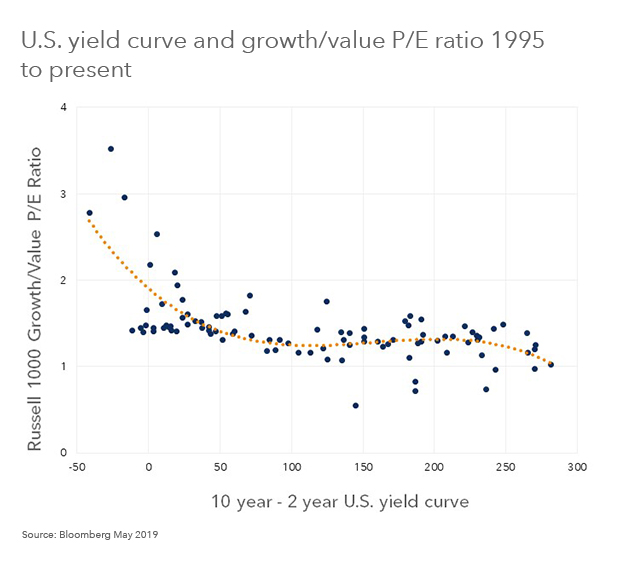
This connection between economic growth and valuations is very visible in the relationship between the yield curve, i.e. the difference between short and longer-term bond yields, and style multiples. As investors have been conditioned to view a flatter yield curve as a sign of economic fragility, you would expect growth multiples to be relatively high when the curve is flat. Historically, that is exactly what you find. Since 1995, the shape of the curve has explained roughly 50% of the variation in growth vs. value multiples (see Chart 1).
To be clear, the relationship is decidedly non-linear. When the curve is close to average – roughly 100 bps – small changes are not particularly significant. When it matters the most is when the curve gets close to zero, raising recession concerns. In these periods investors have typically paid the largest premium for growth stocks.
Today, with growth expectations moderating, trade frictions rising and the curve close to zero, growth’s premium looks about right. As long as investors are bracing for a slower growth world, they are likely to continue to put a premium on those few companies that can deliver earnings growth regardless of the economy.
Russ Koesterich, CFA, is Portfolio Manager for BlackRock’s Global Allocation team and is a regular contributor to The Blog.
Investing involves risks, including possible loss of principal.
This material is not intended to be relied upon as a forecast, research or investment advice, and is not a recommendation, offer or solicitation to buy or sell any securities or to adopt any investment strategy. The opinions expressed are as of June 2019 and may change as subsequent conditions vary. The information and opinions contained in this post are derived from proprietary and nonproprietary sources deemed by BlackRock to be reliable, are not necessarily all-inclusive and are not guaranteed as to accuracy. As such, no warranty of accuracy or reliability is given and no responsibility arising in any other way for errors and omissions (including responsibility to any person by reason of negligence) is accepted by BlackRock, its officers, employees or agents. This post may contain “forward-looking” information that is not purely historical in nature. Such information may include, among other things, projections and forecasts. There is no guarantee that any forecasts made will come to pass. Reliance upon information in this post is at the sole discretion of the reader. Past performance is no guarantee of future results. Index performance is shown for illustrative purposes only. You cannot invest directly in an index.
©2019 BlackRock, Inc. All rights reserved. BLACKROCK is a registered trademark of BlackRock, Inc., or its subsidiaries in the United States and elsewhere. All other marks are the property of their respective owners.
USRMH0619U-864248-1/1


