

by Bryce Coward, CFA, Knowledge Leaders Capital
As political risk continues to escalate, we are, as always, keenly focused on risk management and the mitigation of potential losses. To those ends, we are monitoring indicators of market breadth for evidence that the worst of the shakeout is behind us. Unfortunately, indicators telling us that the worst is over are few, whereas there were plenty of signals confirming last Thursday’s low in stocks.
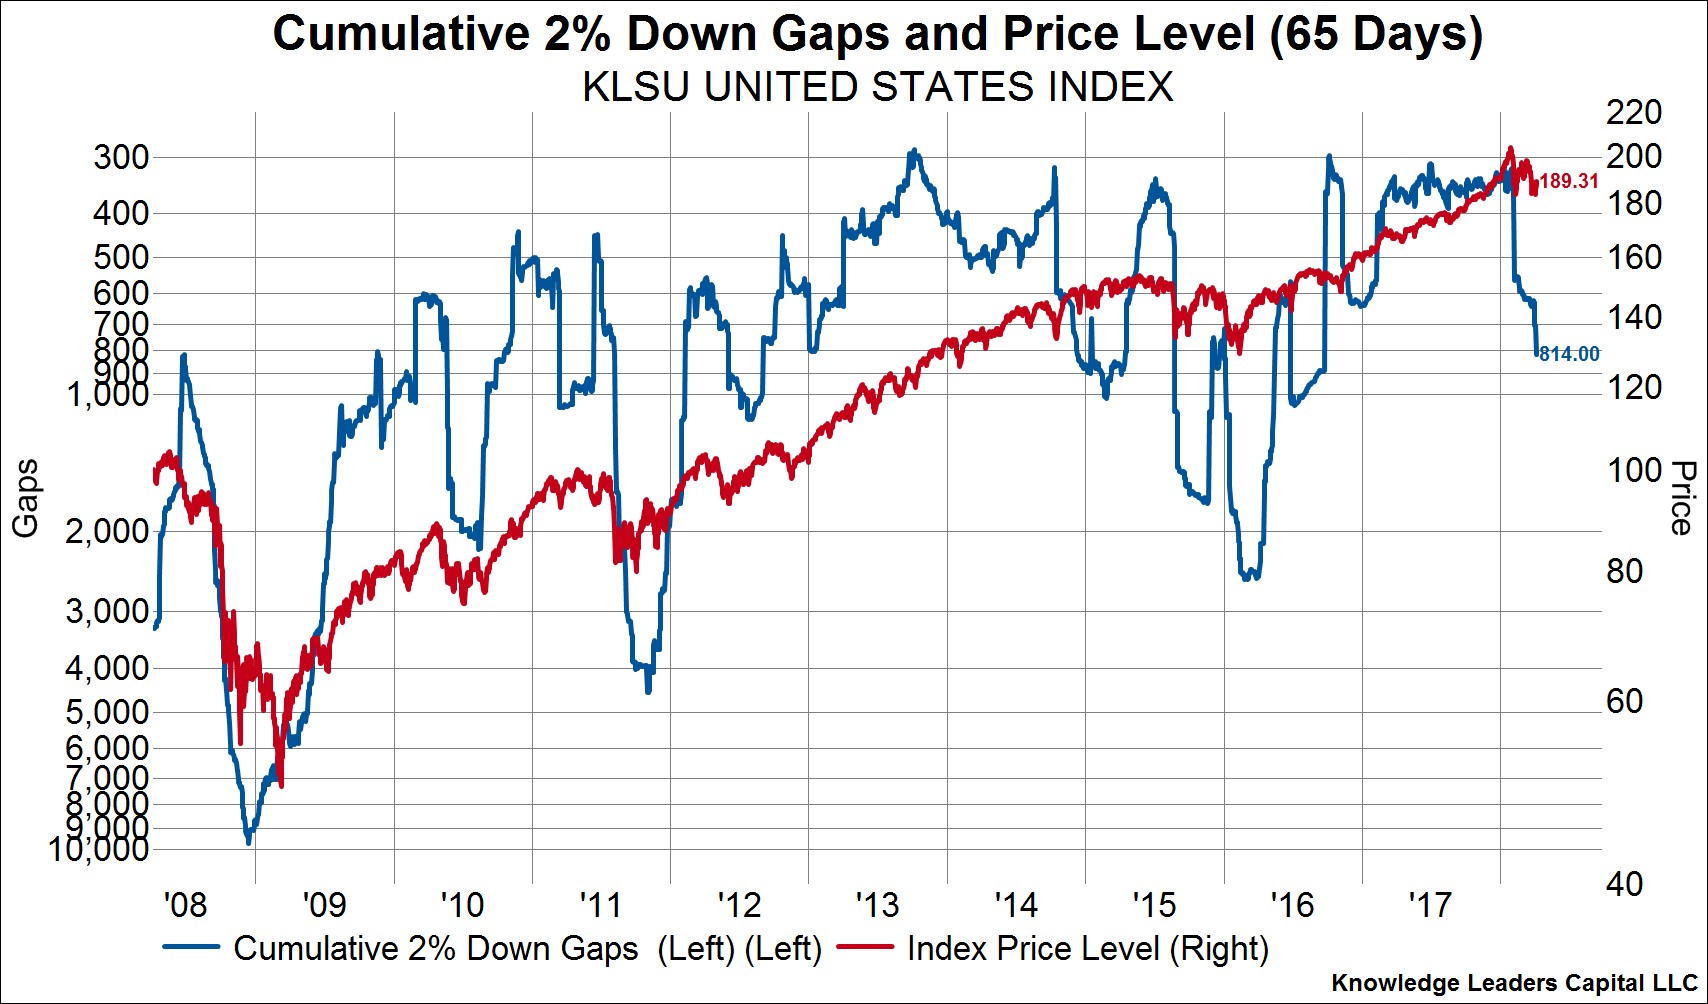
One such indicator is the cumulative number of stocks opening with a 2% down gap over the preceding 65 days. We like this indicator because it signals extremes in investor fear that cause them to place sell orders outside of market hours that are substantially lower than the previous day’s closing price. This indicator continues to make new lows even as stocks have bounced back. What’s more, investor panic as measured by this indicator is not yet at levels consistent with previous good lows. We would like to see 2% down gaps advance toward 2000 (left axis, inverted).
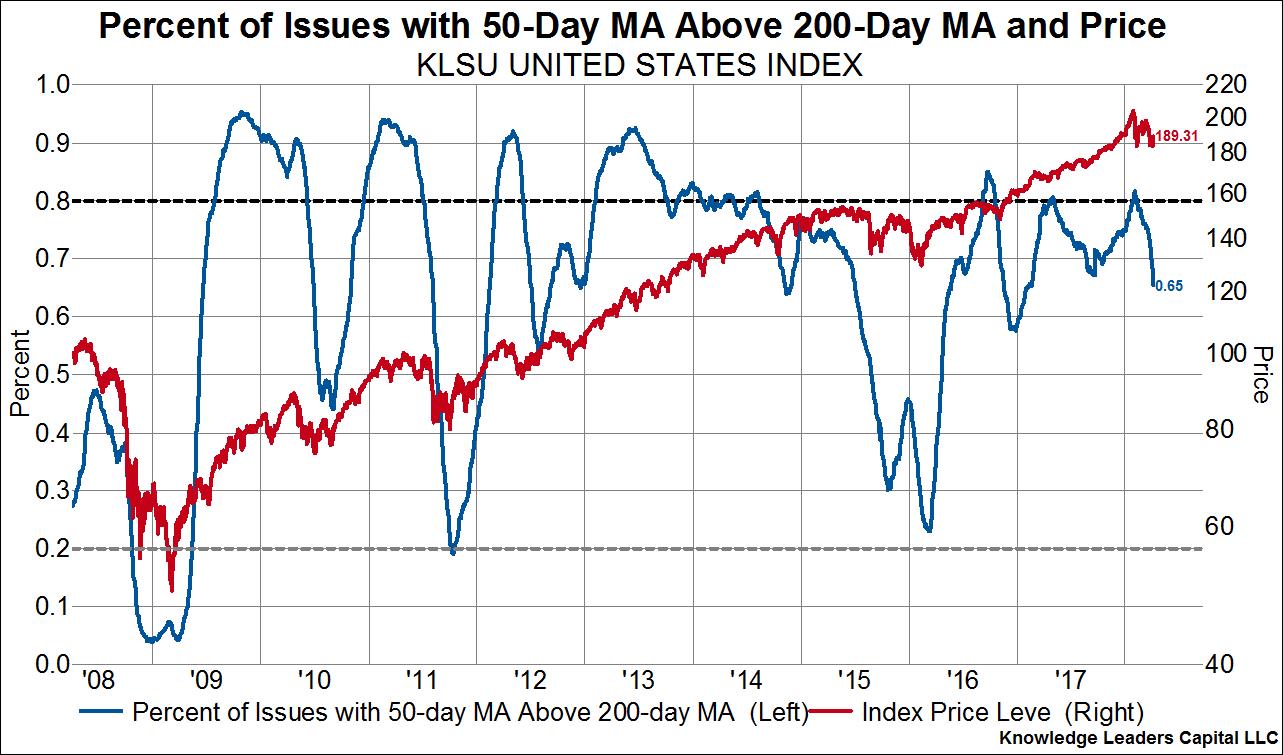
Next, the percent of stocks in an uptrend – those with a 50 day moving average above a 200 day moving average (blue line, left axis) – is 1) still at a high level of 65%, and 2) is falling despite the temporary rebound in equities. At good lows, this indicator will typically fall towards 20%.
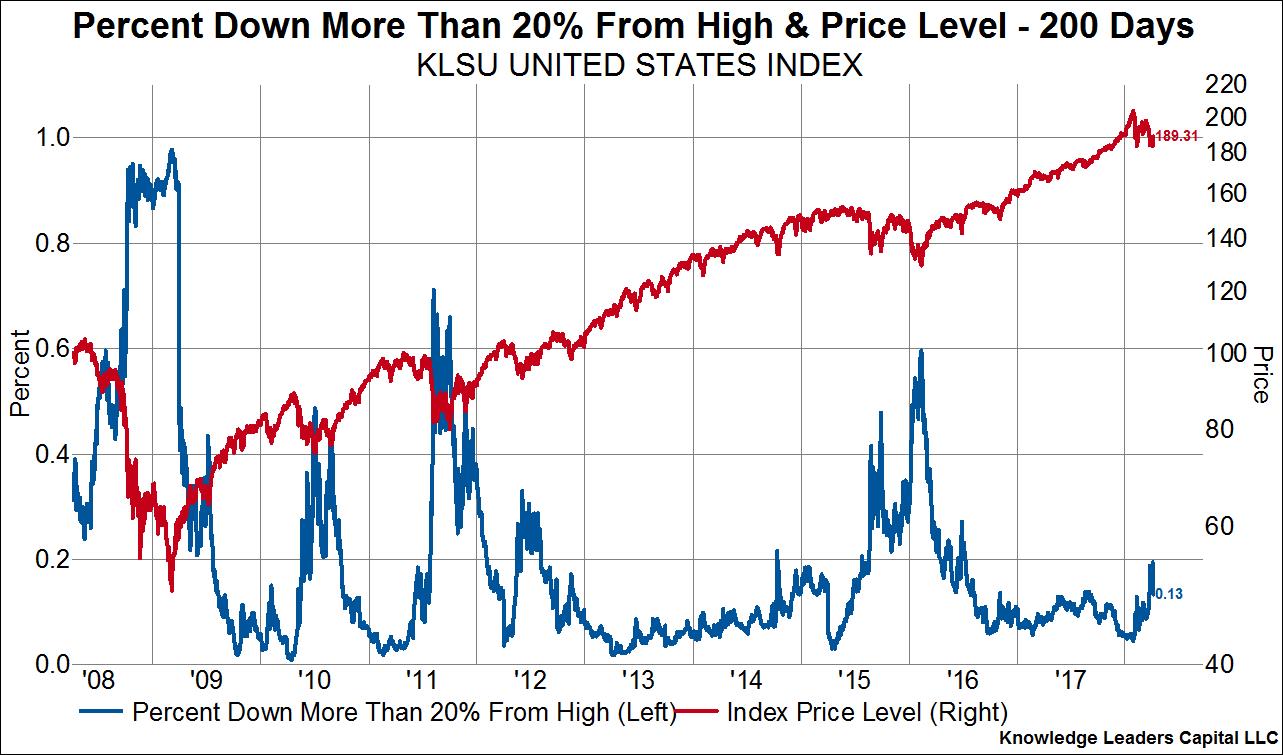
The percent of stocks in a bear market (blue line, left axis) also continues to rise, though it too is at a level inconsistent with previous good lows. As we highlighted previously, good lows are typically associated with upwards of 40% of stocks entering a bear market, as this is the setup for the next leg up in stocks. The current reading of 13% has a ways to go.
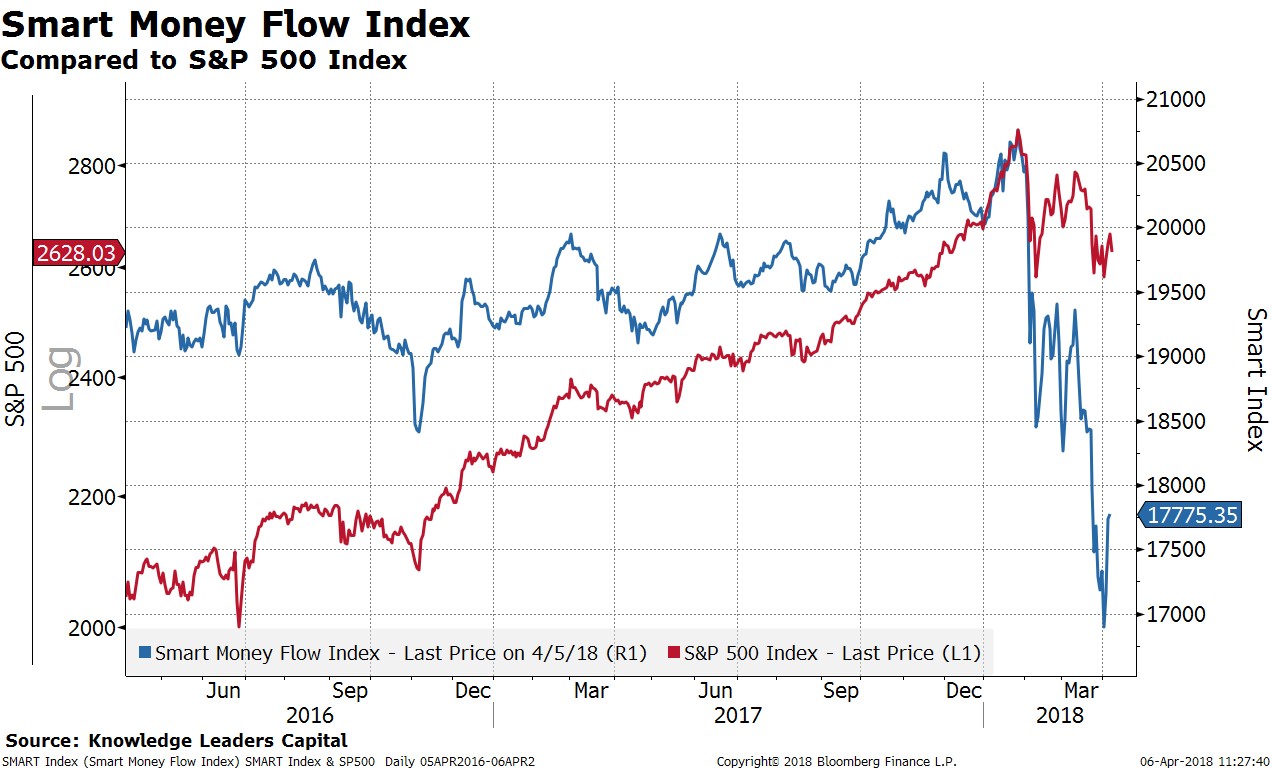
The Smart Money Flow Index (blue line, right axis), which measures how stocks perform in the last hour of trading compared to the first hour of trading (the “smart” money is said to buy/sell in the last hour), also continues to make new lows. Usually this indicator will make a higher low on a retest, but it hasn’t yet.
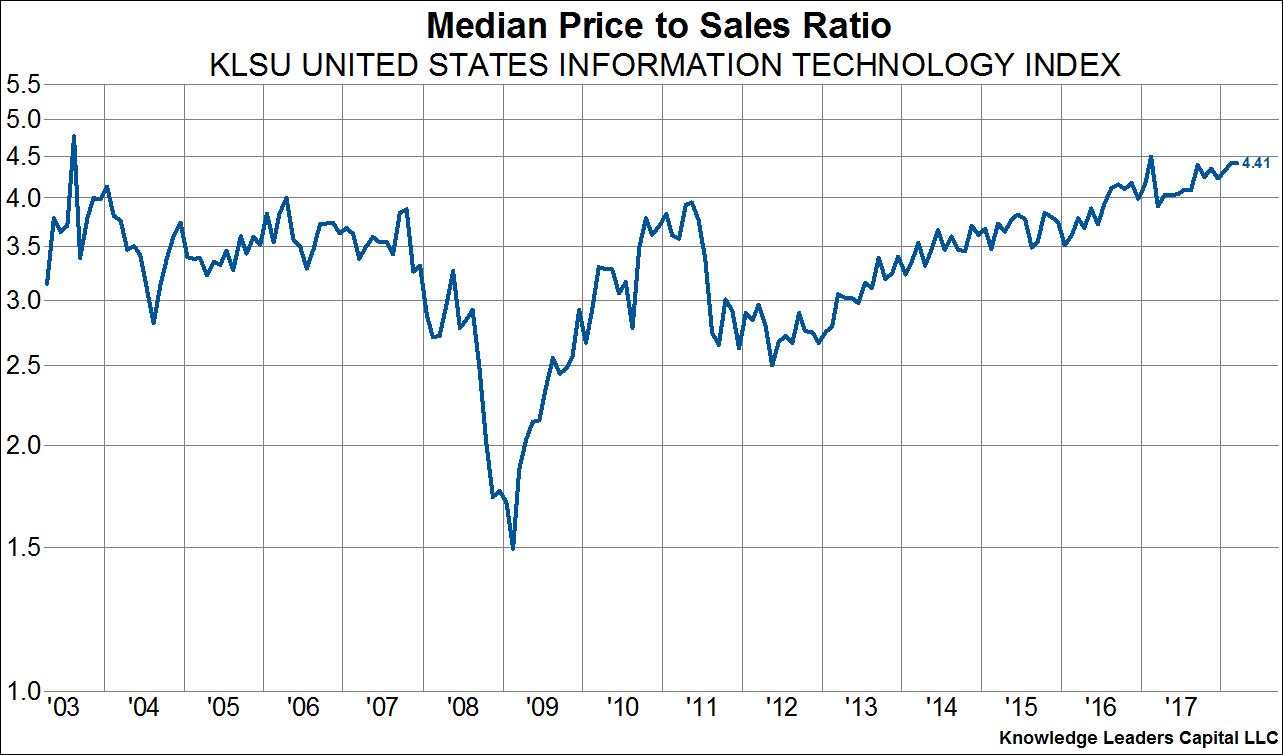
Last but not least, let’s not forget about valuations. The median tech company’s price to sales ratio remains at its highest level outside of the tech bubble. The same can be said for the median price to sales ratio for all stocks.

Copyright © Knowledge Leaders Capital