by Ryan Detrick, LPL Research
The 2017 holiday shopping season has begun. That means Black Friday deals, long checkout lines, and a focus on the retail industry as investors try to determine the potential impacts to the stock market.
The National Retail Federation has estimated sales for the 2017 holiday season could increase between 3.6% and 4% versus 2016 sales—a solid number which is slightly above the post-crisis average of 3.4%. But what do holiday shopping forecasts mean for the stock market (and the retail sector in particular)? Stock market performance from mid-September to mid-December has historically had a high correlation with year-over-year increases in holiday retail sales. The S&P 500 Index has already gained approximately 4% since September 15, and retails sales estimates for the holiday season may give investors another reason to be optimistic.
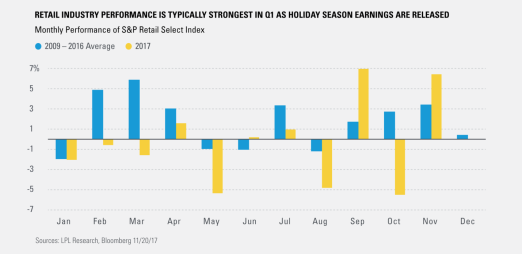
As the chart below shows, retail seasonality doesn’t necessarily follow the shopping schedule of consumers. Since the financial crisis, the S&P Retail Select Industry Index (which includes both online and brick-and-mortar retailers) has performed well heading into the holiday season as analysts start to develop holiday shopping estimates and investor optimism rises. However, the index’s performance during December and January has historically been lackluster as stocks in the index tread water ahead of retailer earnings. February and March have been two of the strongest months on average for the index since 2009 as retailers generally release holiday season earnings over this period.
But will these patterns hold in 2017? The holiday shopping season is important for both online and brick-and-mortar retailers alike; so even if consumers shift their purchases toward online outlets, the seasonal pattern may still make sense. But it is also important to remember that volatility has been high in the retail sector this year, with the index seeing large price swings as markets try to determine winners and losers in an industry where price competition is intense, and the line between online and brick-and-mortar companies continues to blur. Given this market sentiment, it is likely that the performance of individual company stocks may be more dispersed than they have been historically, which may favor active management in the sector moving forward.
IMPORTANT DISCLOSURES
Past performance is no guarantee of future results.
The economic forecasts set forth in the presentation may not develop as predicted.
Investing in stock includes numerous specific risks including: the fluctuation of dividend, loss of principal and potential illiquidity of the investment in a falling market.
Because of their narrow focus, sector investing will be subject to greater volatility than investing more broadly across many sectors and companies.
The S&P 500 Index is a capitalization-weighted index of 500 stocks designed to measure performance of the broad domestic economy through changes in the aggregate market value of 500 stocks representing all major industries.
This research material has been prepared by LPL Financial LLC.
To the extent you are receiving investment advice from a separately registered independent investment advisor, please note that LPL Financial LLC is not an affiliate of and makes no representation with respect to such entity.
Not FDIC/NCUA Insured | Not Bank/Credit Union Guaranteed | May Lose Value | Not Guaranteed by any Government Agency | Not a Bank/Credit Union Deposit
Securities and Advisory services offered through LPL Financial LLC, a Registered Investment Advisor Member FINRA/SIPC
Tracking #1-670643 (11/18)
Copyright © LPL Research


