For this week’s edition of the Equity Leaders Weekly we are going to take a look at two top performing sector ETFs in 2017 both in the US and Globally. First we will look at the U.S. Home Construction sub-sector which has been a top performing US ETF so far this year. We will then take a look at the base metals sector as they have been a top performing sector in Canada in 2017.
iShares U.S. Home Construction Index ETF (ITB)
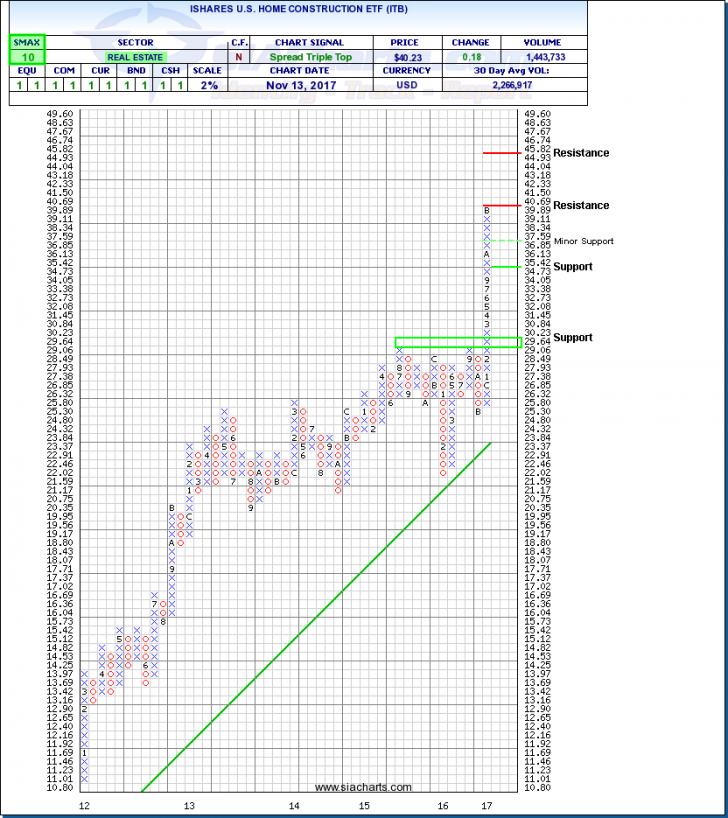
The iShares U.S. Home Construction ETF (ITB) seeks to track the Dow Jones U.S. Select Home Construction Index which tracks 47 companies within the sector. This ETF gives exposure to companies like D R Horton, Lennar A, NVR, Home Depot, and Lowes Companies. The index is up 46.82% in 2017 and has been one of the big winners since President Trump took office last year.
According to the National Association of Home Builders, new home sales in the US were up 10% at the end of September which has been steadily climbing with only 3 months posting lower sales than the month before (April, July and August). According to a Zack’s Equity Research article on November 15, 2017, total earnings for the construction sector are up 11% on 13.8% higher revenues, with 81.8% beating EPS estimates and 63.6% beating on revenues for Q3.
Looking at the 2% ITB chart we can see that the rally since the beginning of the year has been largely uninterrupted with the chart being in a column of X’s since last November. When looking at a chart like this it can be difficult to find support and resistance however a quick glance at a candlestick chart shows that there has been some previous resistance at $30 and $35 which may infer that the $40 may see some resistance as well. These previous resistance levels at $35 and $30 will now serve as support areas for ITB. With and SMAX of 10 out of 10, ITB is showing near term strength versus the asset classes.

iShares S&P/TSX Global Base Metals Index ETF (XBM.TO)
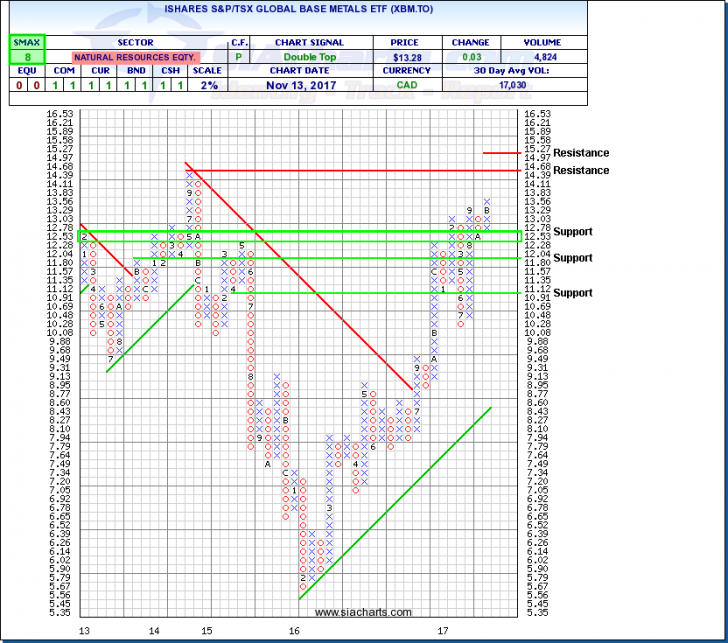
The iShares S&P/TSX Global Base Metals Index ETF (XBM.TO) is a global sector play and has exposure to companies that produce or extract base metals around the world. Geographically the make up of the index is Canada (32%), United States (24%), United Kingdom (20%), Australia (10%) with India, China and Peru making up the rest. The Canadian ETF is up ~20% year to date on the back of rising base metals prices like copper which is up 23% so far in 2017. Other base metals include aluminum, lead, nickel and zinc.
Taking a look at the 2% chart for XBM.TO we can see that it has been in an uptrend since early 2016 with periods of consolidation and breakouts. After a large pull back from February to July this year, the ETF has rebounded back and looks to test highs not seen since September of 2014. $14.68 will be a key resistance level to watch to see if the ETF can break to new intermediate highs. Above this, $15 might serve as a psychological resistance level. Support for ITB comes in at ~$12.50, ~$12 and $11. With an SMAX of 8 out of 10, XBM.TO is showing near term strength against most of the asset classes.
For a more in-depth analysis on the relative strength of the equity markets, fixed income, commodities, currencies, etc. or for more information on SIACharts.com, you can contact our sales and customer support at 1-877-668-1332 or at siateam@siacharts.com.

SIACharts.com specifically represents that it does not give investment advice or advocate the purchase or sale of any security or investment. None of the information contained in this website or document constitutes an offer to sell or the solicitation of an offer to buy any security or other investment or an offer to provide investment services of any kind. Neither SIACharts.com (FundCharts Inc.) nor its third party content providers shall be liable for any errors, inaccuracies or delays in content, or for any actions taken in reliance thereon.


