


by Research, Capital Group
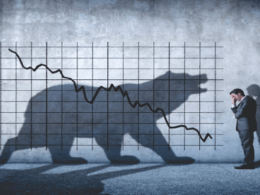
You wouldn't be human if you didn't fear loss.
Nobel Prize-winning psychologist Daniel Kahneman demonstrated this with his loss aversion theory, showing that people feel the pain of losing money more than they enjoy gains. The natural instinct is to flee the market when it starts to plummet, just as greed prompts people to jump back in when stocks are skyrocketing. Both can have negative impacts.
We don't know what the rest of this year will bring. But smart investing can overcome the power of emotion by focusing on relevant research, solid data and proven strategies. Here are seven principles that can help fight the urge to make emotional decisions in times of market turmoil.
1. Market declines are part of investing
Over long periods of time, stocks tend to move steadily higher, but history tells us that stock market declines are an inevitable part of investing. The good news is that corrections (defined as a 10% or more decline), bear markets (an extended 20% or more decline) and other challenging patches haven't lasted forever.
Market downturns happen frequently but don't last forever
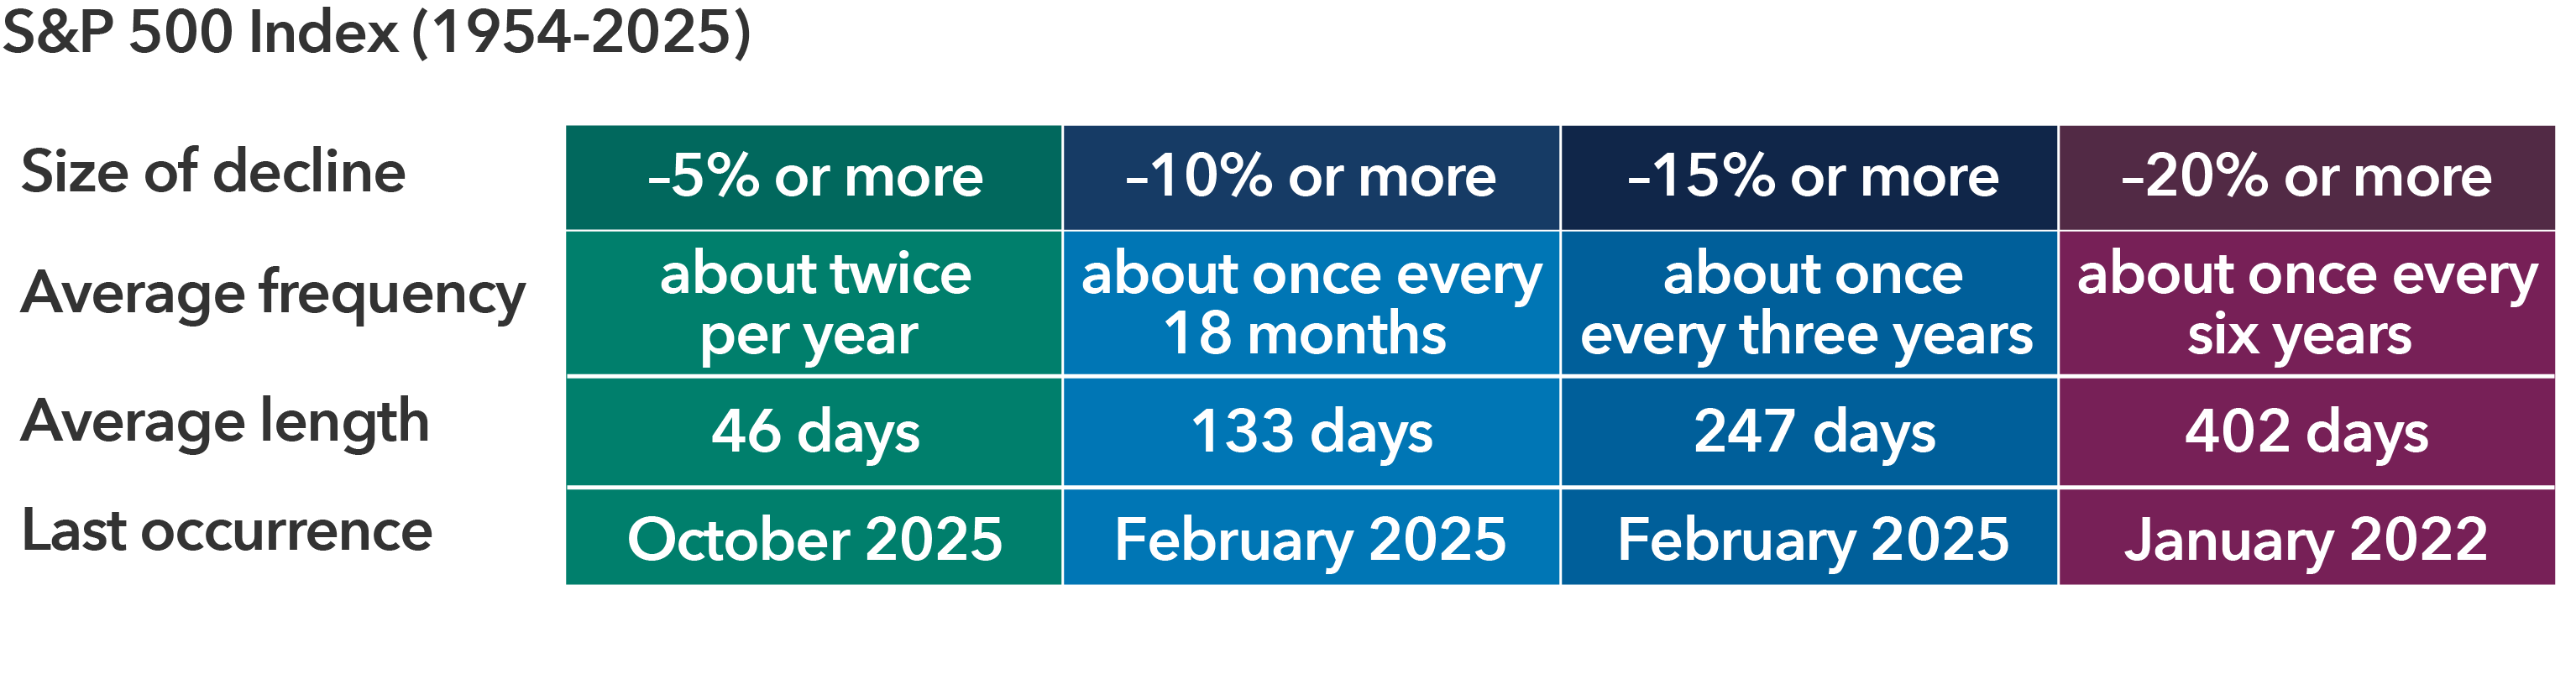
Sources: Capital Group, RIMES, S&P. As of December 31, 2025. Average frequency assumes 50% recovery of lost value. Average length measures market high to market low. Based in USD.
The S&P 500 Index has typically dipped at least 10% about once every 18 months, and 20% or more about every six years, according to data from 1952 to 2025. While past results are not predictive of future results, each downturn has been followed by a recovery and a new market high.
2. Time in the market matters, not market timing
No one can accurately predict short-term market moves, and investors who sit on the sidelines risk losing out on periods of meaningful price appreciation that follow downturns.
Every S&P 500 decline of 15% or more, from 1929 through 2025, has been followed by a recovery. The average return in the first year after each of these declines was 52%.
Even missing out on just a few trading days can take a toll. In U.S. dollar terms, a hypothetical investment of $10,000 in the S&P 500 made in 2016 would have grown to $33,492 by the end of 2025. But if an investor missed just the 10 best trading days during that period, he or she would have ended up with just $17,454, or 48% less.
Missing just a few of the market's best days can hurt investment returns
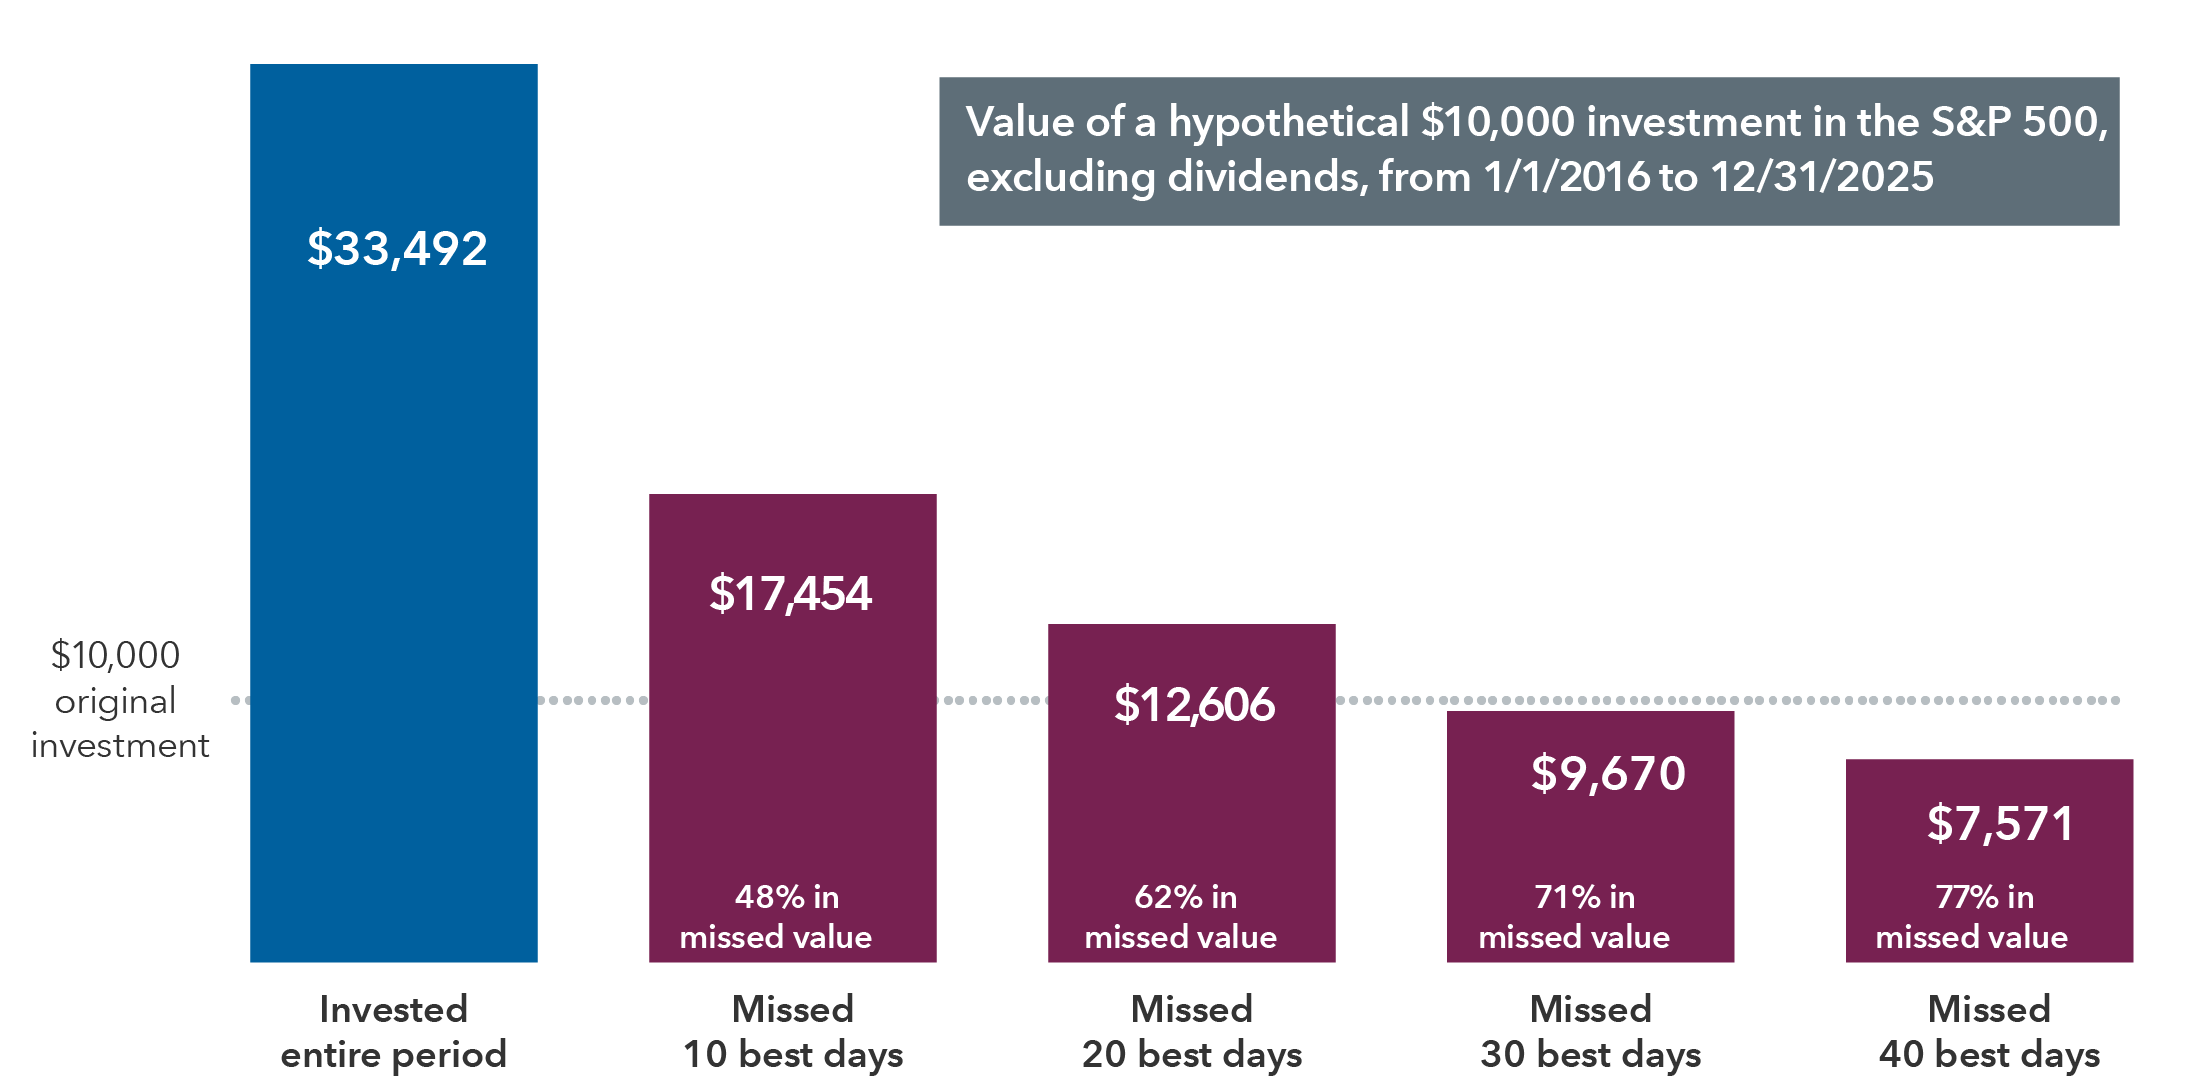
Sources: RIMES, S&P. As of December 31, 2025. Values in USD.
3. Emotional investing can be hazardous
Kahneman won the Nobel Prize in 2002 for his work in behavioural economics, a field that investigates how individuals make financial decisions. A key finding of behavioural economists is that people often act irrationally when making such choices.
Emotional reactions to market events are perfectly normal. Investors should expect to feel nervous when markets decline, but it's the actions taken during such periods that can mean the difference between investment success and shortfall.
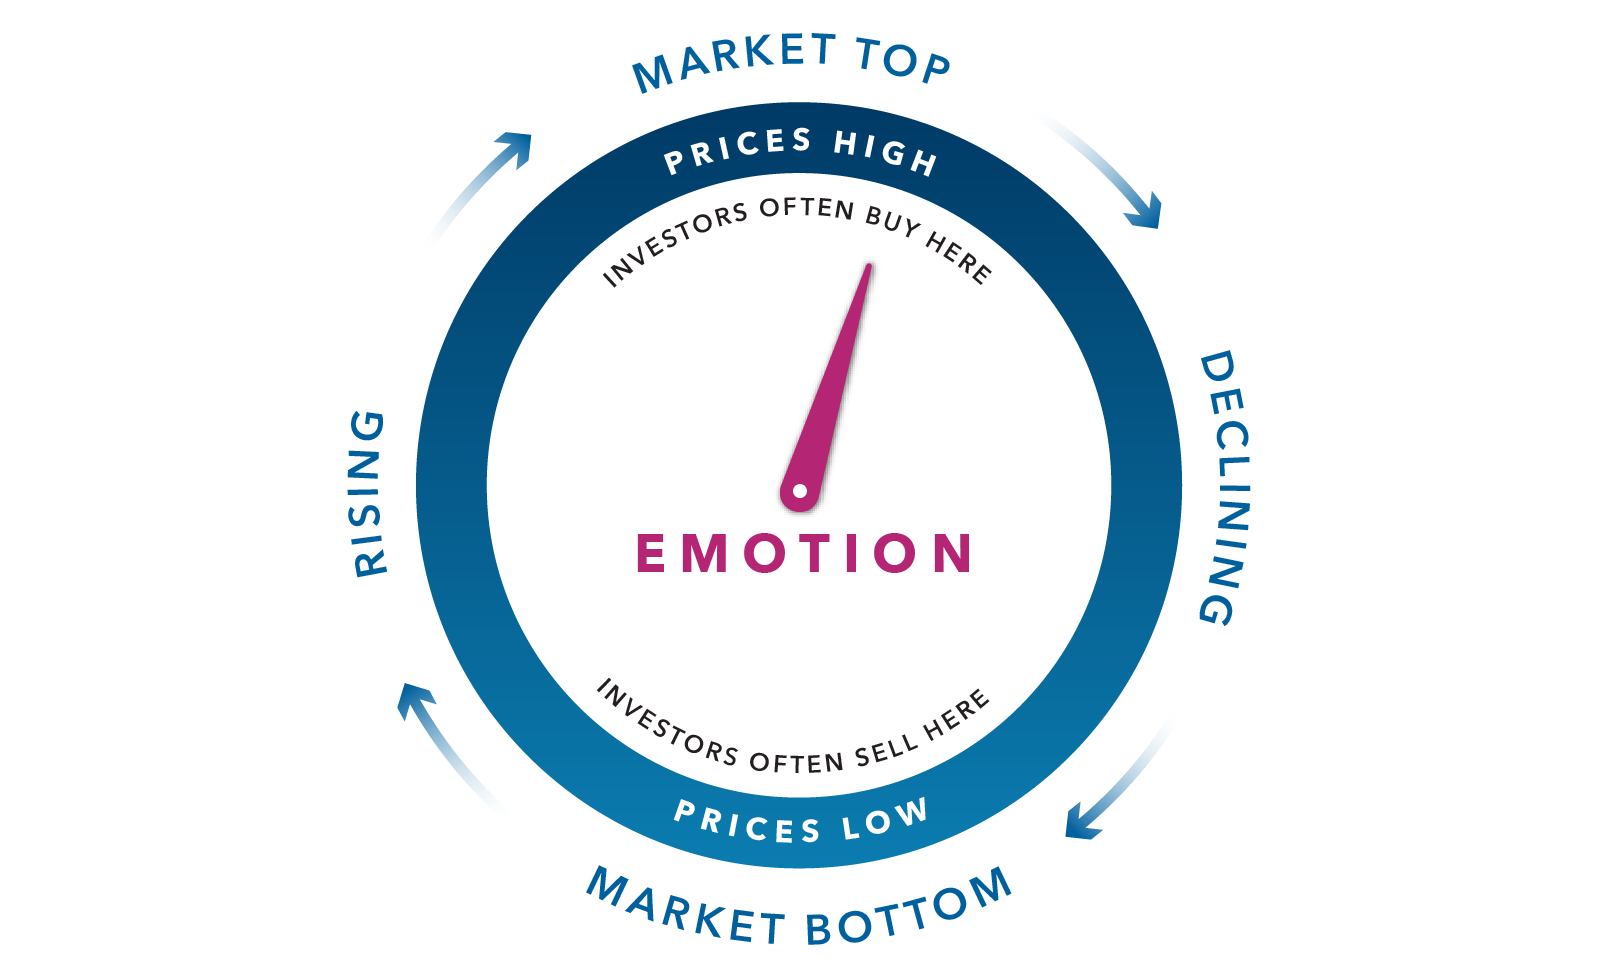
Source: Capital Group.
One way to encourage rational investment decision-making is to understand the fundamentals of behavioural economics. Recognizing behaviours like anchoring, confirmation bias and availability bias may help investors identify potential mistakes before they make them.
4. Make a plan and stick to it
Creating and adhering to a thoughtfully constructed investment plan is another way to avoid making short-sighted investment decisions — particularly when markets move lower. The plan should take into account a number of factors, including risk tolerance and short- and long-term goals.
One way to avoid futile attempts to time the market is with dollar cost averaging, where a fixed amount of money is invested at regular intervals, regardless of market ups and downs. This approach creates a strategy in which more shares are purchased at lower prices and fewer shares are purchased at higher prices. Over time investors pay less, on average, per share. Regular investing does not ensure a profit or protect against loss. Investors should consider their willingness to keep investing when share prices are declining.
When stock prices fall, you can get more shares for the same amount of money and lower your average cost per share
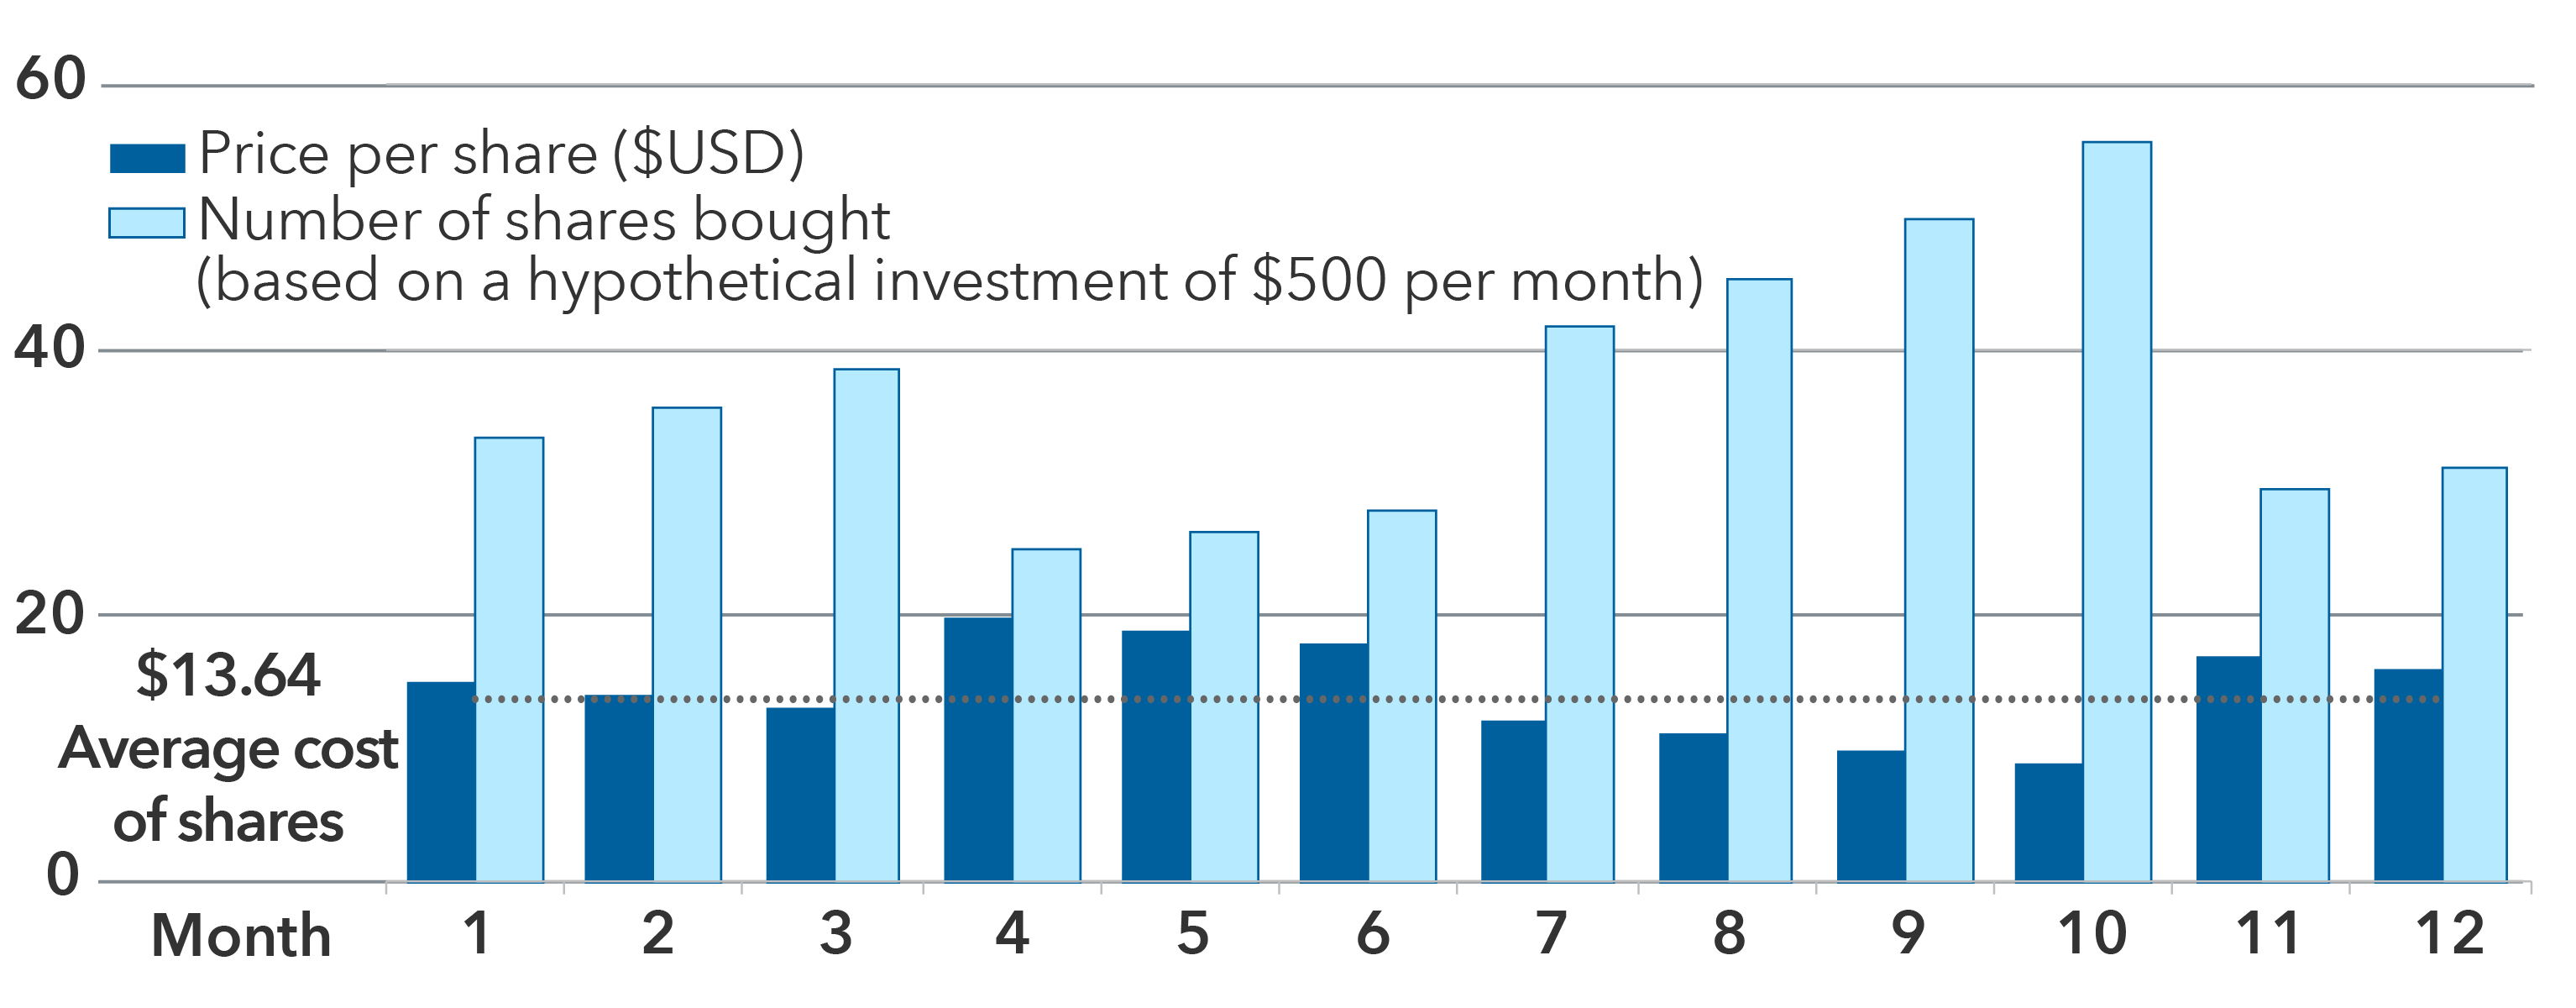
Source: Capital Group. Over the 12-month period, the total amount invested was $6,000, and the total number of shares purchased was 439.94. The average price at which the shares traded was $15, and the average cost of the shares was $13.64 ($6,000/439.94). Hypothetical results are for illustrative purposes only and in no way represent the actual results of a specific investment.
Retirement plans, to which investors make automatic contributions with each paycheque, are a prime example of dollar cost averaging.
5. Diversification matters
A diversified portfolio doesn't guarantee profits or provide assurances that investments won't decrease in value, but it does help lower risk. By spreading investments across a variety of asset classes, investors can buffer the effects of volatility on their portfolios. Overall returns won't reach the highest highs of any single investment — but they won't hit the lowest lows either.
For investors who want to avoid some of the stress of downturns, diversification may help lower volatility.
Asset classes go in and out of favour
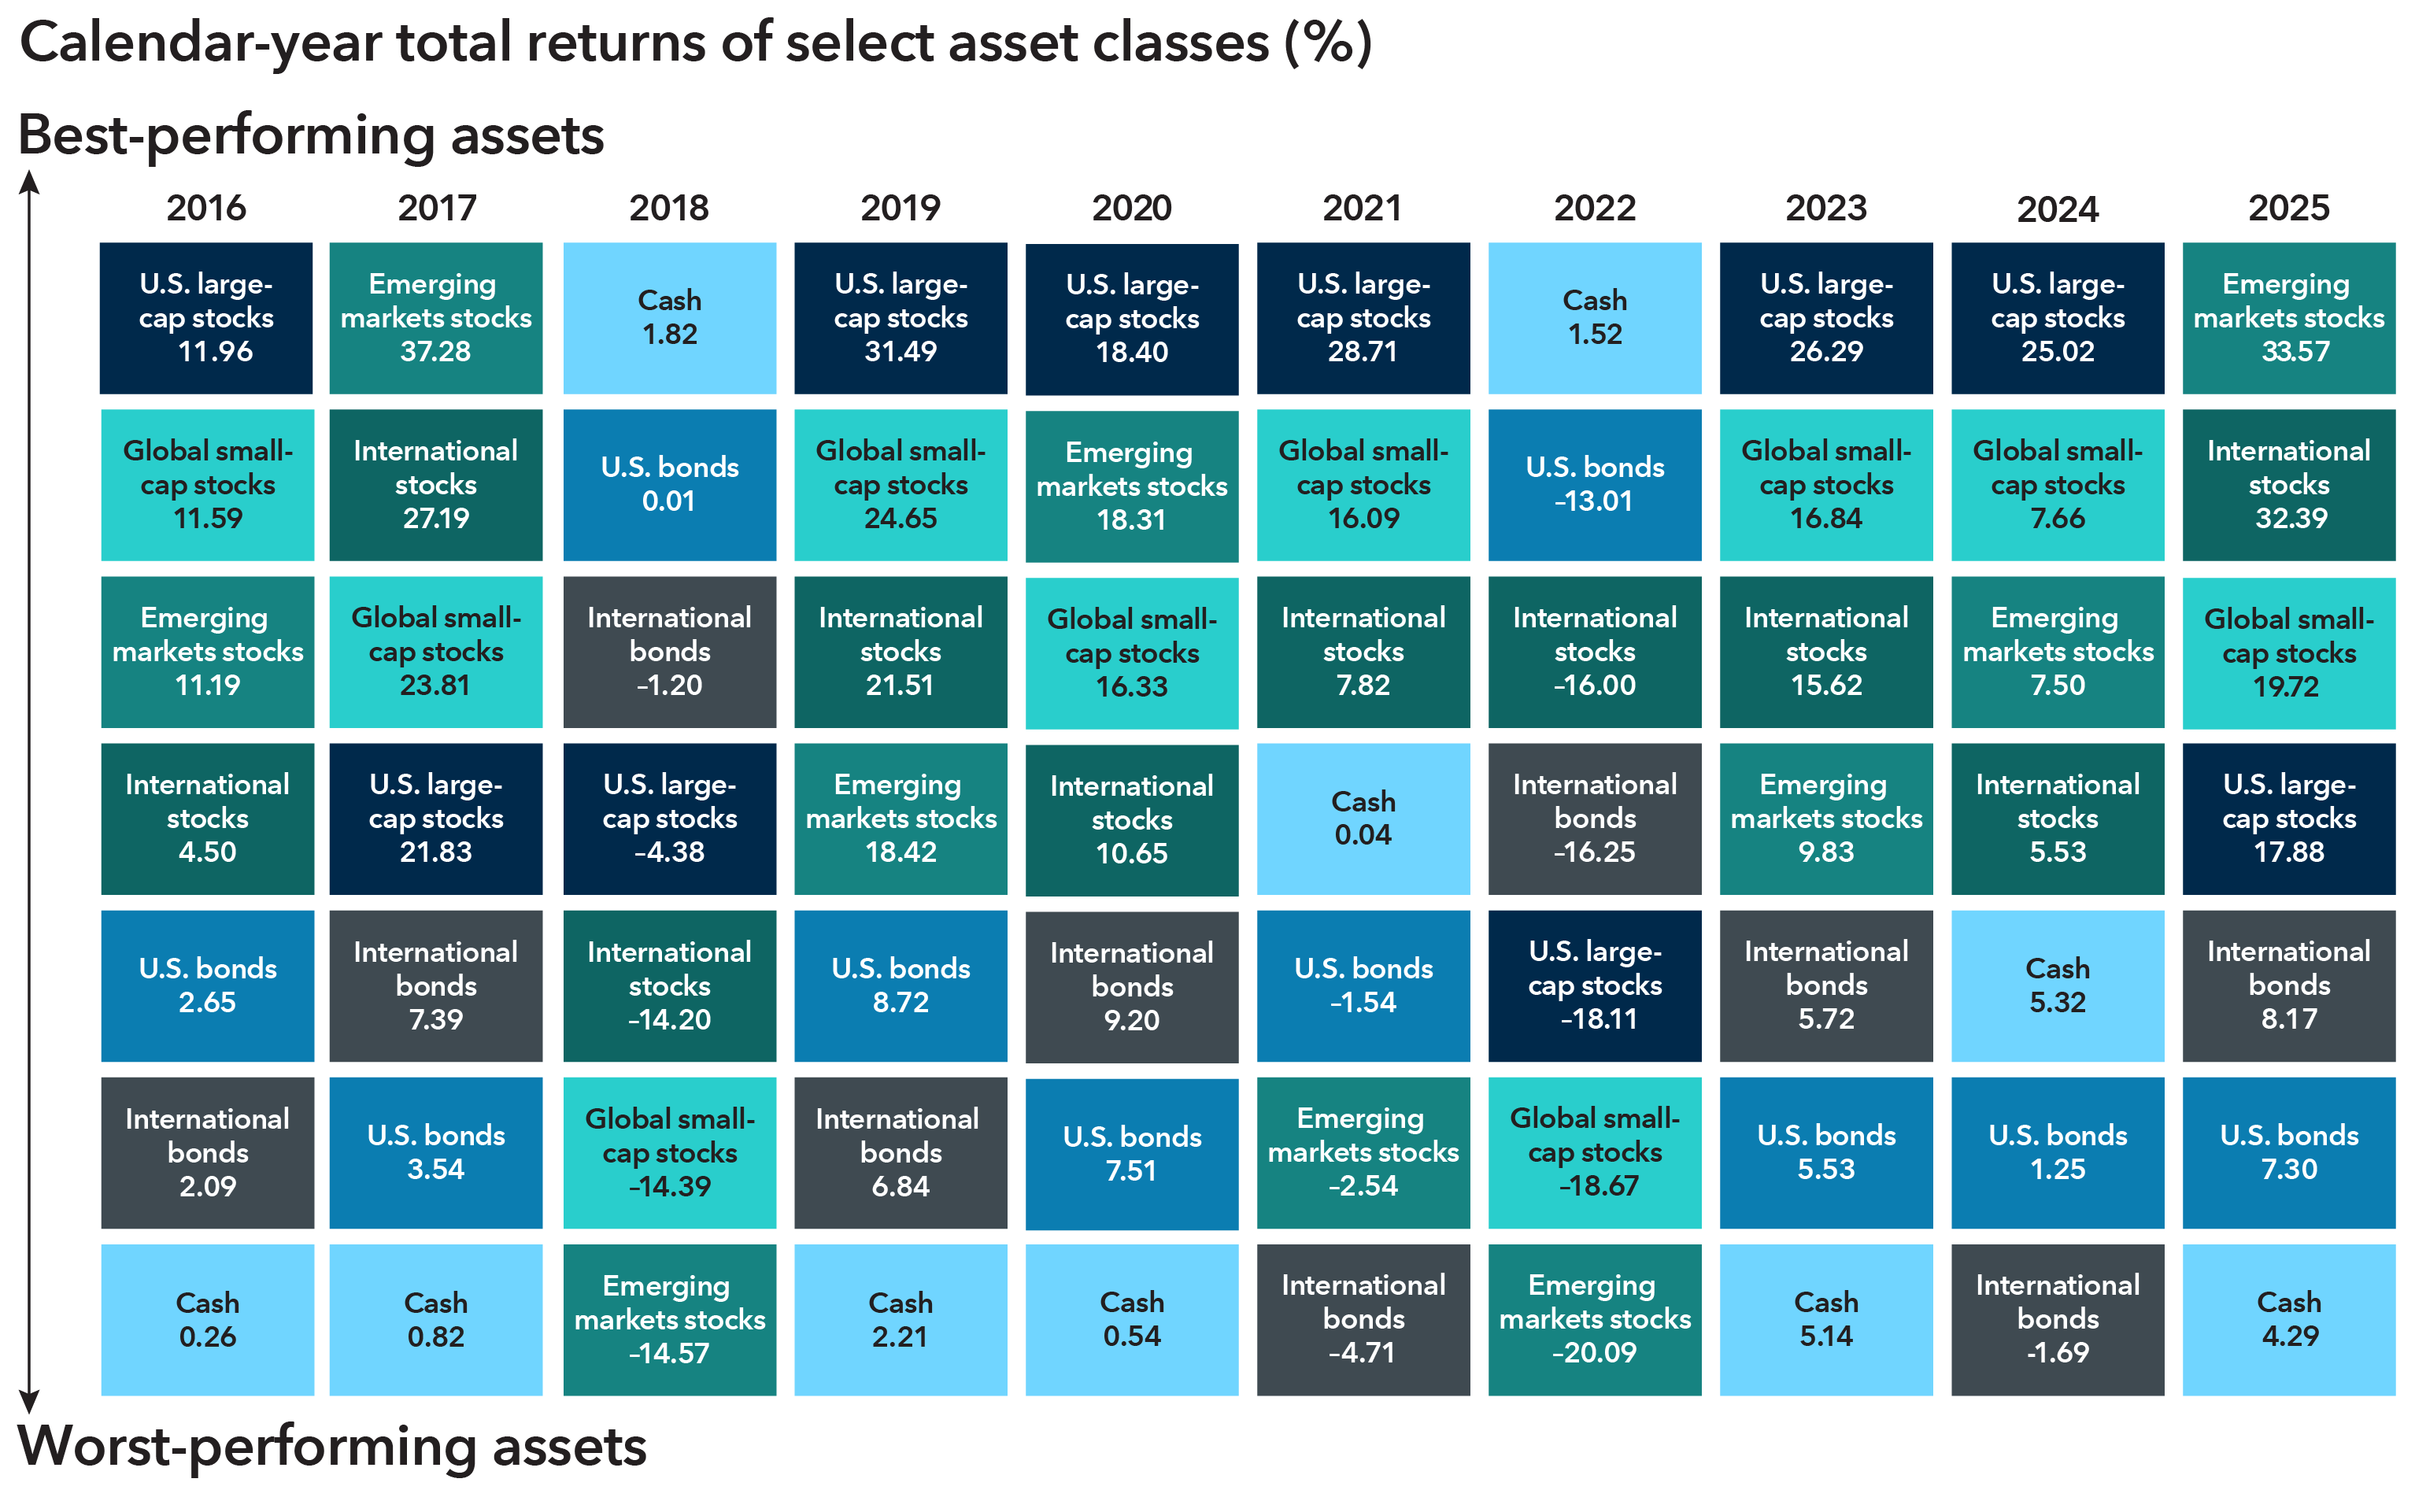
Sources: LSEG Datastream, RIMES. U.S. large-cap stocks — S&P 500 Index; Global small-cap stocks — MSCI All Country World Small Cap Index; International stocks — MSCI All Country World ex USA Index; Emerging markets stocks — MSCI Emerging Markets Index; U.S. bonds — Bloomberg U.S. Aggregate Index; International bonds — Bloomberg Global Aggregate Bond Index; cash — Bloomberg U.S. Treasury Bills Index: 1–3 Months. As of December 31, 2025. Based in USD.
6. Fixed income can help bring balance
Stocks are important building blocks of a diversified portfolio, but bonds can provide an essential counterbalance. That's because bonds typically have low correlation to the stock market, meaning that they have tended to zig when the stock market zagged.
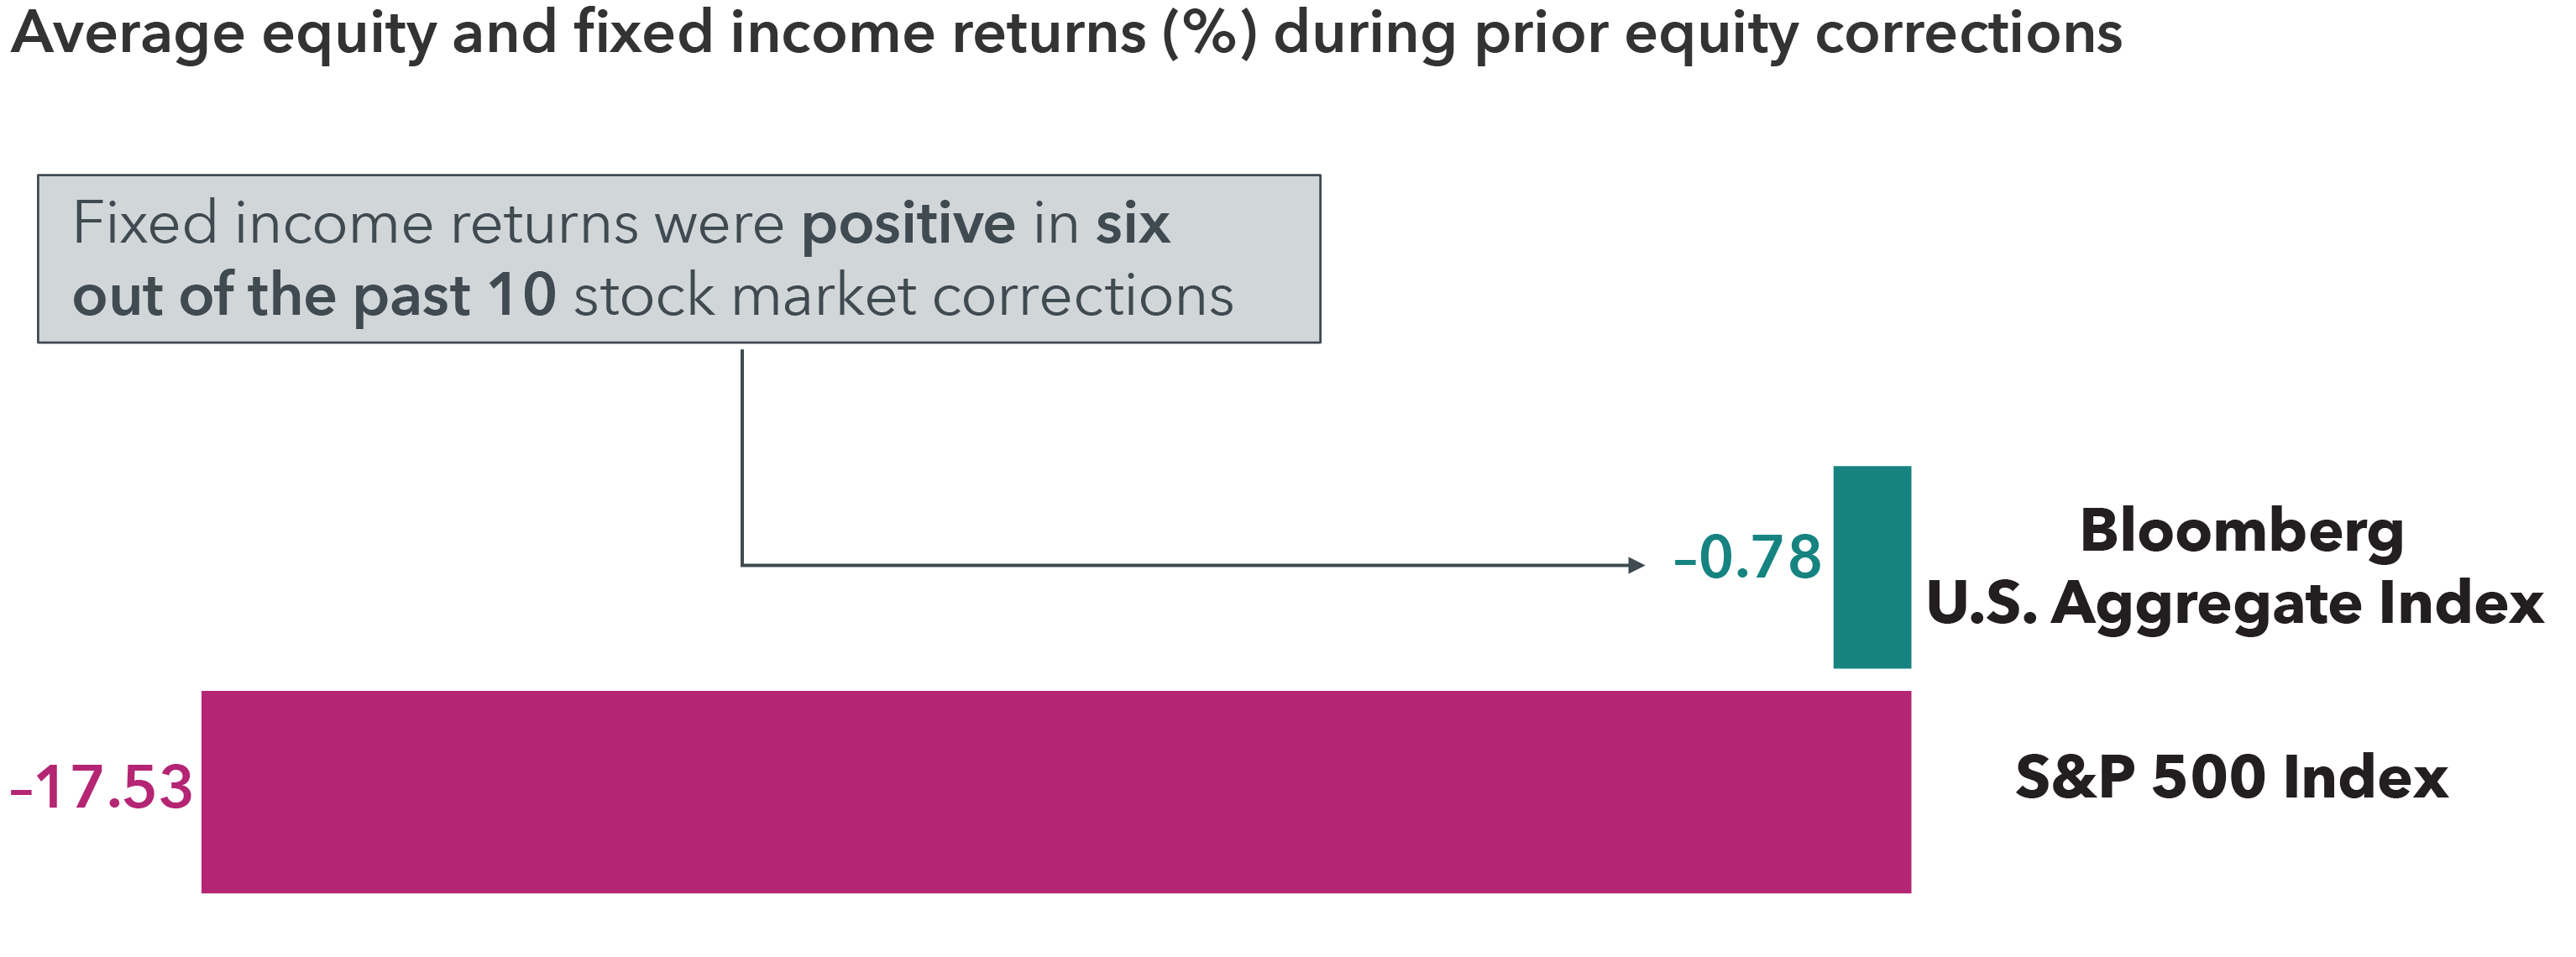
Sources: Capital Group, Morningstar. As of December 31, 2025. Averages were calculated by using the cumulative total returns in USD of the S&P 500 Index and the Bloomberg U.S. Aggregate Bond Index during the nine equity market correction periods since 2010: April 23, 2010, to July 2, 2010; April 29 2011, to October 3, 2011; May 21, 2015, to August 25, 2015; November 3, 2015, to February 11, 2016; January 26, 2018, to February 8, 2018; September 20, 2018, to December 24, 2018; February 19, 2020, to March 23, 2020; January 3, 2022, to October 12, 2022; July 31, 2023, to October 27, 2023; and February 20, 2025, to April 8, 2025. Corrections are based on price declines of 10% or more (without dividends reinvested) in the S&P 500 Index with at least 75% recovery.
What's more, bonds with a low equity correlation can potentially help soften the impact of stock market losses on your overall portfolio. Funds providing this diversification can help create durable portfolios, and investors should seek bond funds with strong track records of positive returns through a variety of markets.
Though bonds may not be able to match the growth potential of stocks, they have often shown resilience in past equity declines. The market selloff in 2022 was unique in that many bonds did not play their typical safe-haven role. But in the five market declines prior to 2022, bonds — as measured by the Bloomberg U.S. Aggregate Bond Index — rose four times and never declined more than 1%.
7. The market tends to reward long-term investors
Is it reasonable to expect 30% returns every year? Of course not. And if stocks have moved lower in recent weeks, you shouldn't expect that to be the start of a long-term trend, either. Behavioural economics tells us recent events carry an outsized influence on our perceptions and decisions.
It's always important to maintain a long-term perspective, but especially when markets are declining. Although stocks rise and fall in the short term, they've tended to reward investors over longer periods of time. Even including downturns, the S&P 500’s average annual return over all 10-year periods from 1939 to 2025 was 10.97%.
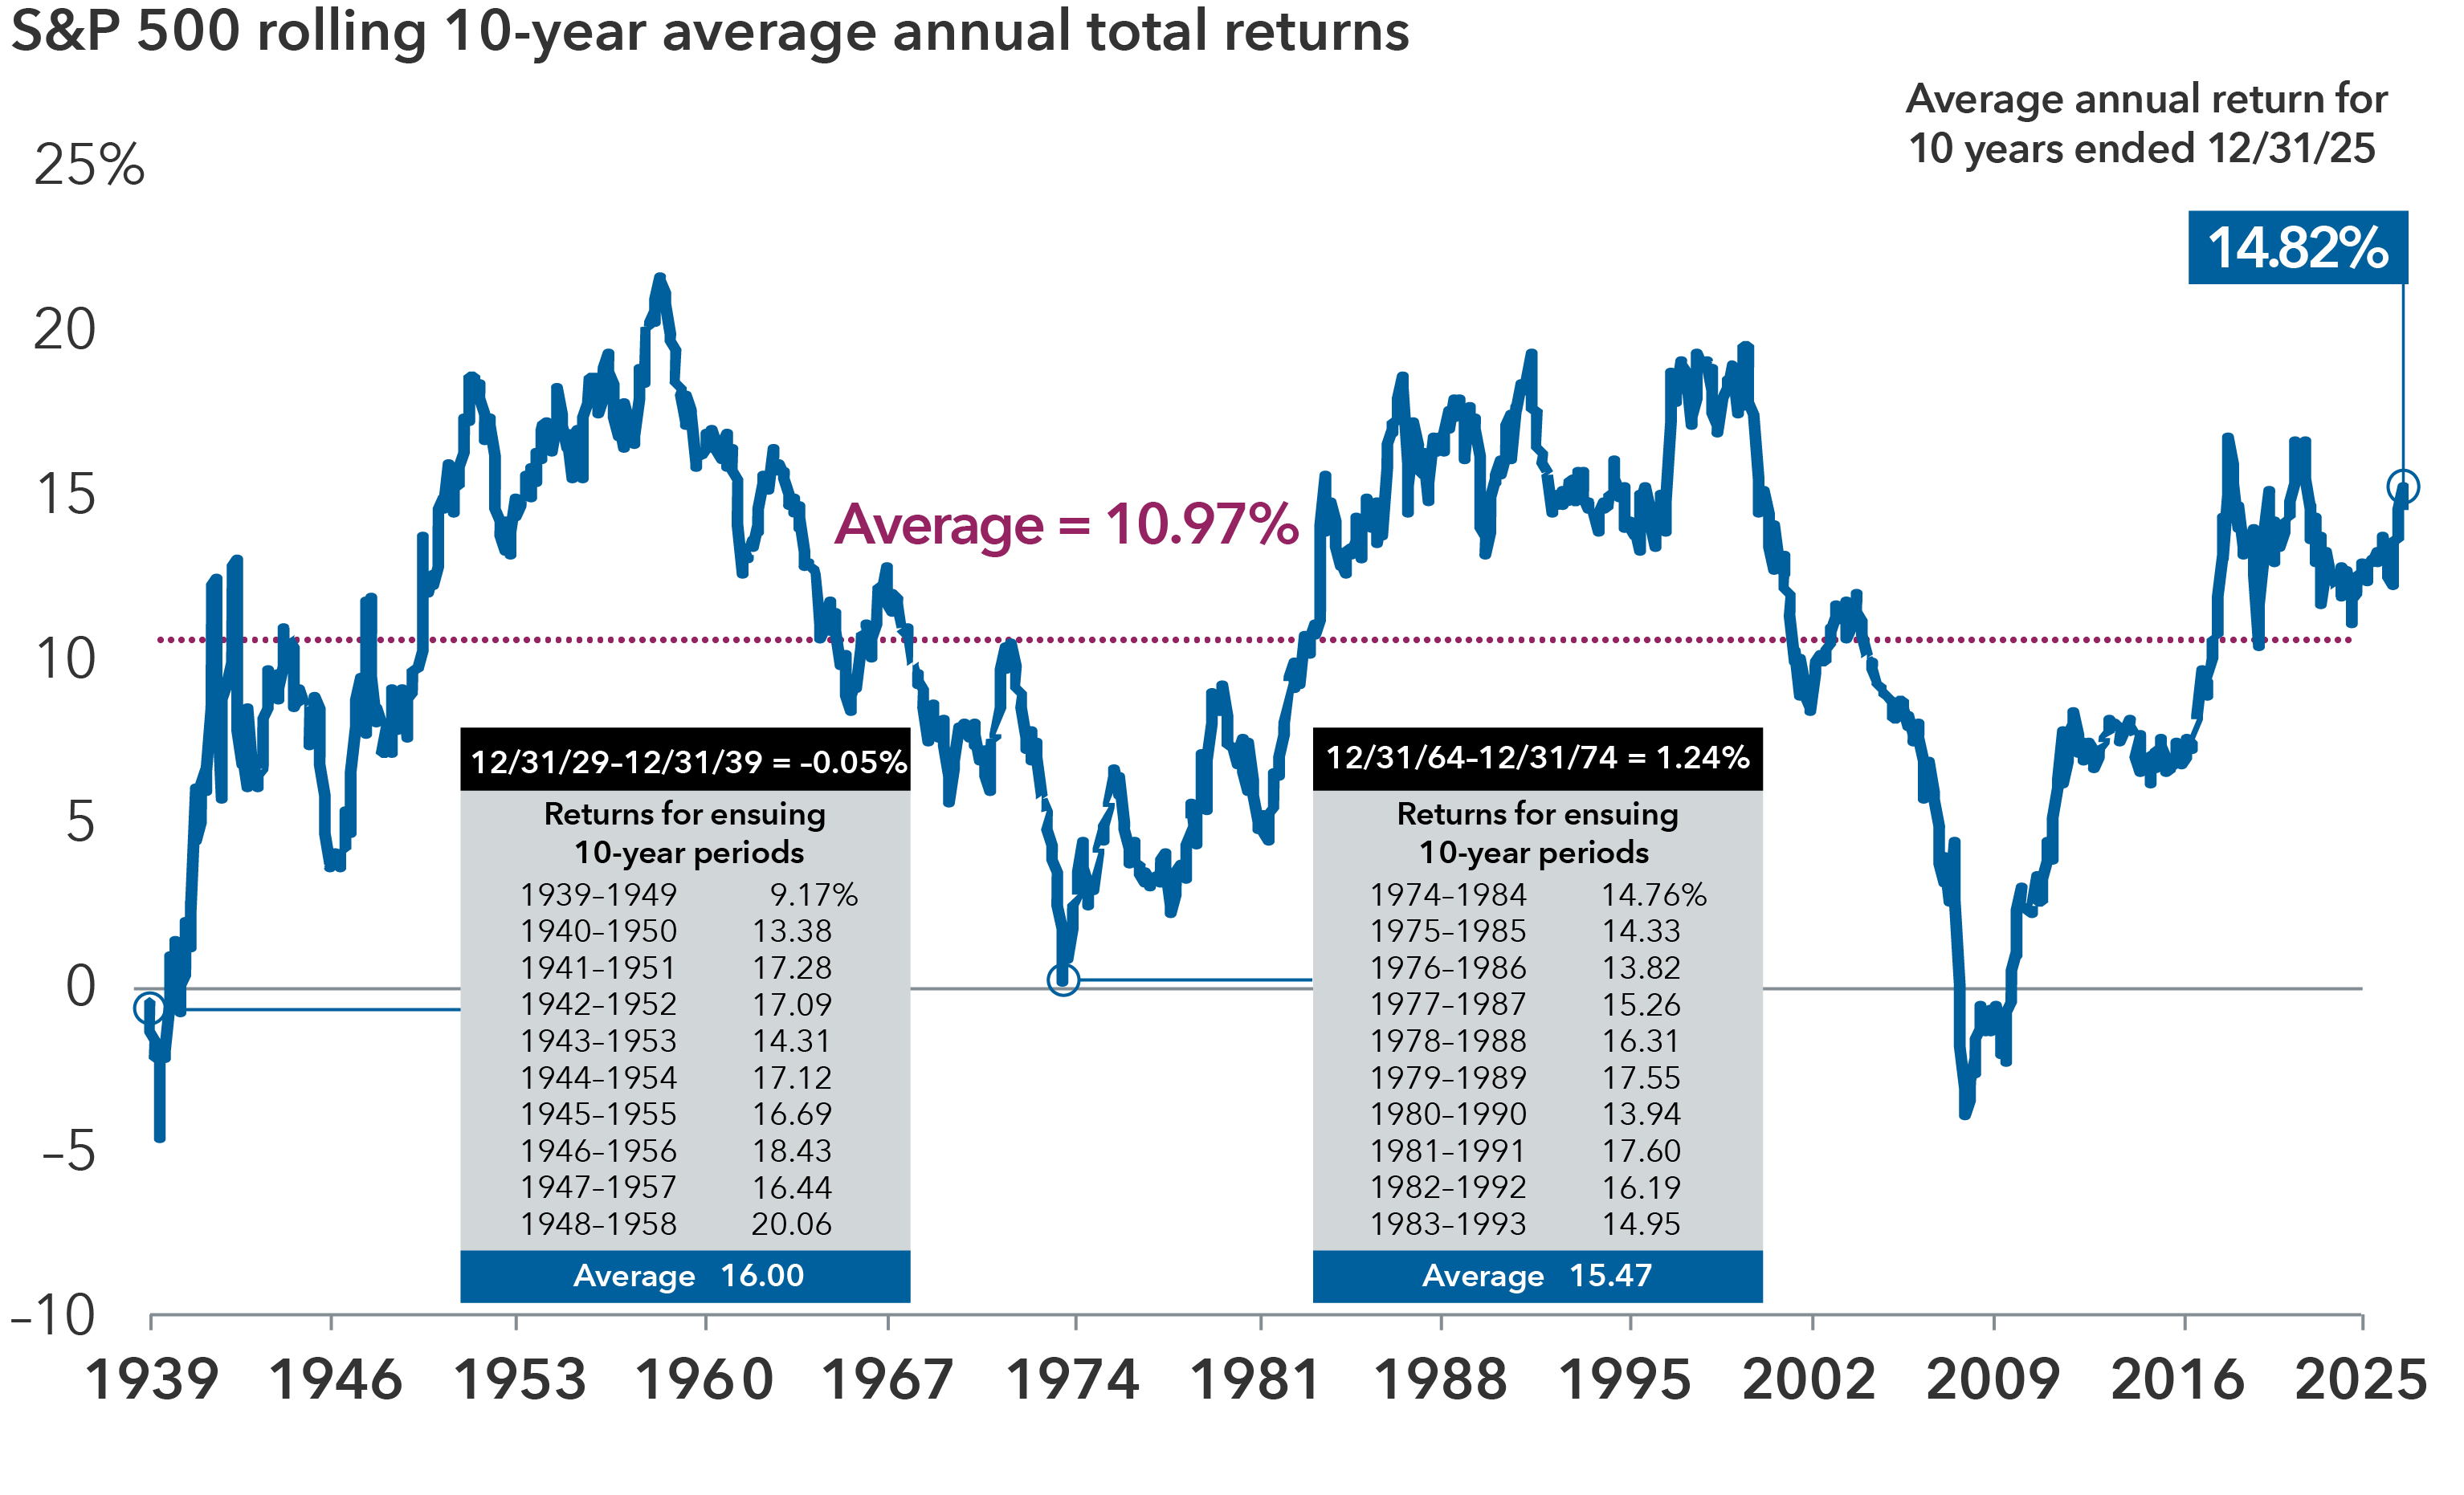
Sources: Capital Group, Morningstar, RIMES, S&P. As of December 31, 2025. Based on rolling monthly 10-year periods. Returns are in USD.
It's natural for emotions to bubble up during periods of volatility. Those investors who can tune out the news and focus on their long-term goals are better positioned to plot out a wise investment strategy.
Copyright © Capital Group